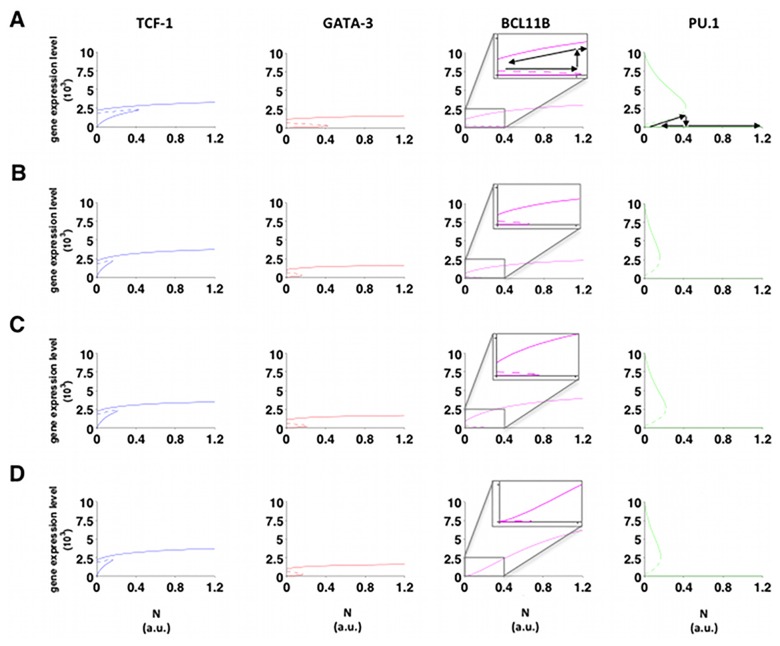
Fig 4. Bifurcation analysis.
Bifurcation analysis with respect to the maximum value for the Notch signalling for the winning combinatorial configurations: (A) dimer TCF-1 AND (Notch OR dimer GATA-3); (B) dimer GATA-3 AND (Notch OR TCF-1); (C) dimer GATA-3 AND (Notch OR dimer TCF-1); (D) Notch AND TCF-1 AND dimer GATA-3. Blue lines: TCF-1; red lines: GATA-3; magenta lines: BCL11B; green lines: PU.1. Continuous lines: stable states; dashed lines: unstable states. For BCL11B the bifurcation region is enlarged for the bistability regions in the different solutions. For both BCL11B and PU.1 arrows are drawn along the paths when increasing or decreasing the maximum Notch value.

