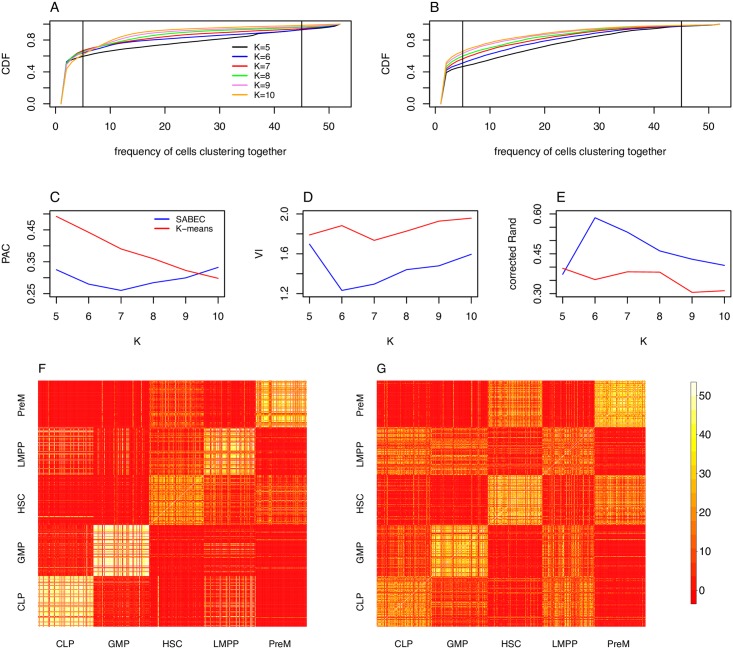
Fig 8. Consensus clustering comparison of SABEC and K-means.
In the case of the Moignard dataset, SABEC is better than K-means at grouping cells by their FACS label. (A, B) For each pair of cells, we can count the number of times a pair of cells cluster together– a cumulative density function of these values, for K varying from 5 to 10, is shown in for SABEC (A) and K-means (B). Pairs of cells that are grouped together greater than 10% of the time and less than 90% of the time–represented by the vertical lines in (A) and (B)– are considered to be ambiguously clustered. (C) The proportion of cells that are ambiguously clustered (PAC) for SABEC and K-means is used to evaluate the robustness of the clustering approach. (D, E) Next we quantify the accuracy of the clusters, as compared to the labelled values (as per FACS). Specifically, this was done using the variable information (VI) (D) and the corrected Rand index (corrected Rand) (E). (F, G) The full consensus matrix, by cell type label according to FACS, for K = 6 are shown for SABEC (F) and K-means (G).

