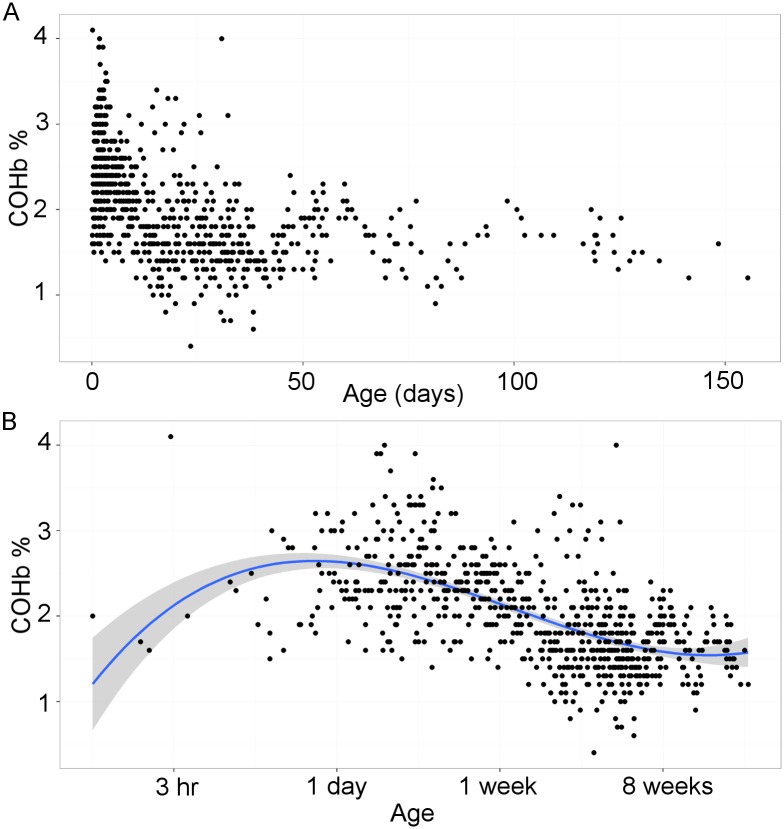
Fig 1. Variation in carboxyhemoglobin levels with postnatal age.
(A) Carboxyhemoglobin levels plotted against postnatal age on a linear scale. (B) Carboxyhemoglobin levels plotted against postnatal age on a logarithmic scale. Solid line indicates the line of best fit using a third order polynomial (cubic) function and shaded region indicates 95% confidence interval.

