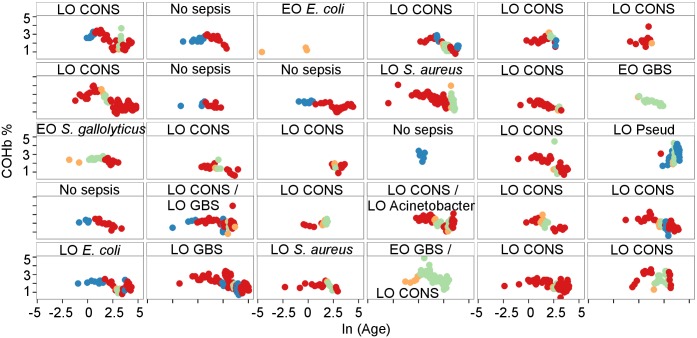
Fig 2. Carboxyhemoglobin levels in individual subjects in relation to postnatal age and episodes of sepsis.
Trellis plot of COHb levels over time (ln (Age)) for each individual subject and relationship to presence or absence of sepsis (red, no sepsis; blue, suspected sepsis; orange, onset of proven sepsis; green, established sepsis). Timing and cause of sepsis are indicated for each individual (EO, early onset; LO, late onset; GBS, Group B Streptococcus; CONS, coagulase-negative Staphylococcus; Pseud, Pseudomonas aeruginosa; Acinetobacter, Acinetobacter sp.)

