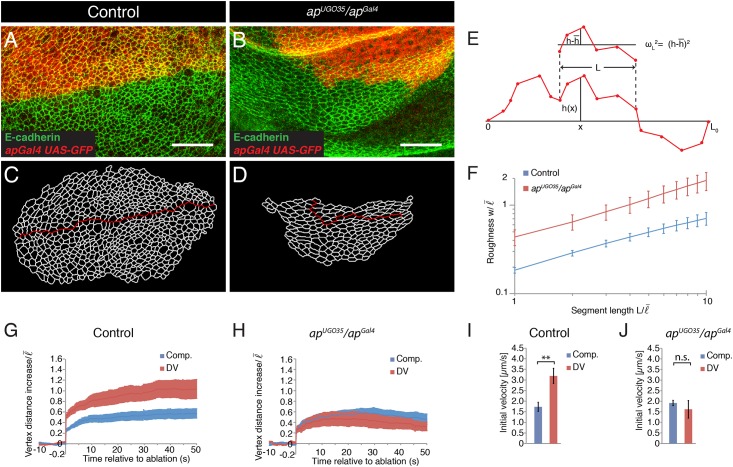
Fig 1. Apterous is required for the characteristic straight shape of the DV boundary and for the local increase in cell bond tension.
(A,B) Wing discs from apGal4 (control) and apUGO35/apGal4 mutant larvae expressing GFP (red) in the dorsal compartment stained for E-cadherin (green) to visualize adherens junctions. Scale bars: 10 μm. (C,D) Segmentation of the images shown in (A) and (B). The red line marks the DV boundary. (E) Scheme depicting the measurement of roughness w of a boundary. The shape of the boundary is described by the function h(x) as the orthogonal distance of the boundary from the x axis, connecting the end points of the boundary, for any position x. For two points within the segment length L roughness is given by the average deviation from the mean value, , where is the average of h(x) within the segment length L. We then average roughness along the boundary for any L indicated. (F) Roughness w of the DV boundary for the segment lengths L for the genotypes indicated in (A,B). Segment length and roughness values are normalized by the average cell bond length in the tissue = 1.7 μm. Mean and s.e.m. are shown (control, n = 6 wing discs; mutant, n = 7 wing discs). P <0.05 for L = 1–10. (G,H) Change in distance d between the vertices of cell bonds located within the compartments (comp.) or at the DV boundary after ablation (normalized to ) as a function of time for wing discs of apGal4 (control) and apUGO35/apGal4 mutant larvae. Mean and s.e.m. are shown (control, n = 10 comp., n = 11 DV; mutant, n = 9 comp., n = 6 DV cuts). (I,J) Initial velocity of vertex displacement after ablation of the indicated types of cell bonds for control (I) and apUGO35/apGal4 mutant (J) larvae. Mean and s.e.m. are shown (n as in G,H). ** P<0.01; n.s. not significant.

