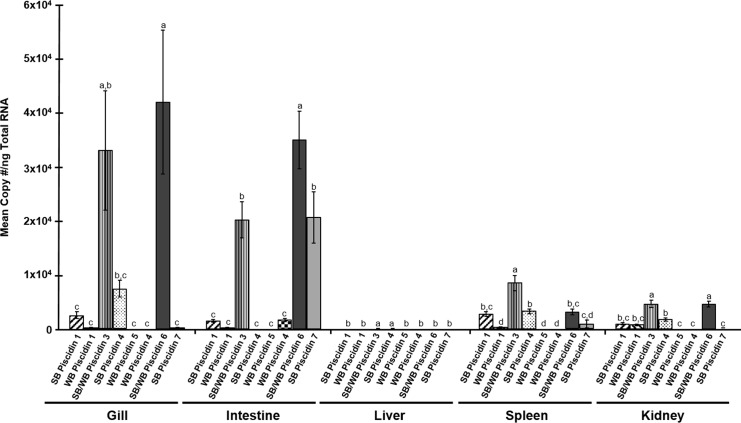
Fig 7. Constitutive tissue expression of piscidin gene transcripts in different tissues of hybrid striped bass.
Bars indicate mean copy number per ng Total RNA ± SE. The letters above each bar denote statistical differences between the piscidins within each tissue (Tukey’s HSD; P = 0.05). Primers designed for piscidins 3 and 6 measured the expression of both striped bass and white bass forms in the hybrid striped bass.

