
Fig 2. Bifidobacterium protected intestinal barrier function in vitro and in a rat NEC model.
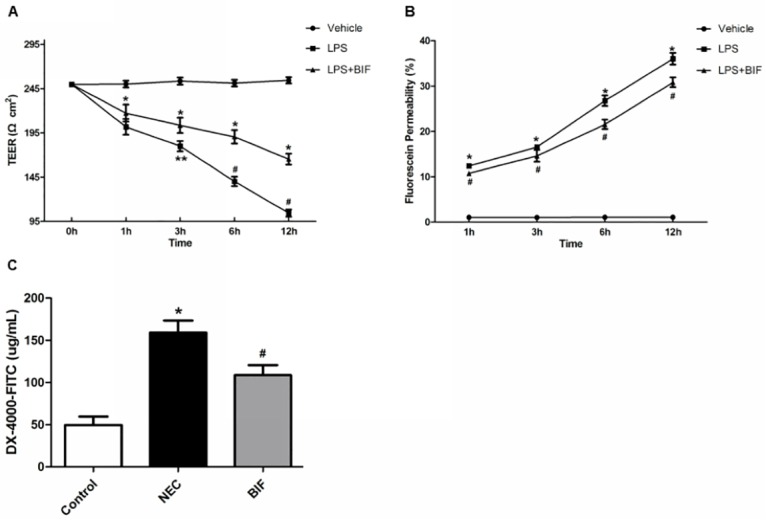
(A) The transepithelial electrical resistance (TEER) was tested at different time points. *P < 0.01 vs the vehicle group, #P < 0.01, **P < 0.05 vs the LPS group. Values are mean ± SD from four independent experiments performedin duplicate. (B) Intestinal permeability was assessed in vitro using the fluorescein permeability (P) test at different time points, *P < 0.01 vs the vehicle group, #P < 0.01 vs the LPS group. (C) The intestinal barrier function in vivo was evaluated by fluorescent dextran–FITC. *P < 0.01 vs the control group, #P < 0.01 vs the NEC group, n = 6 animals per group.