
FIG. 10.
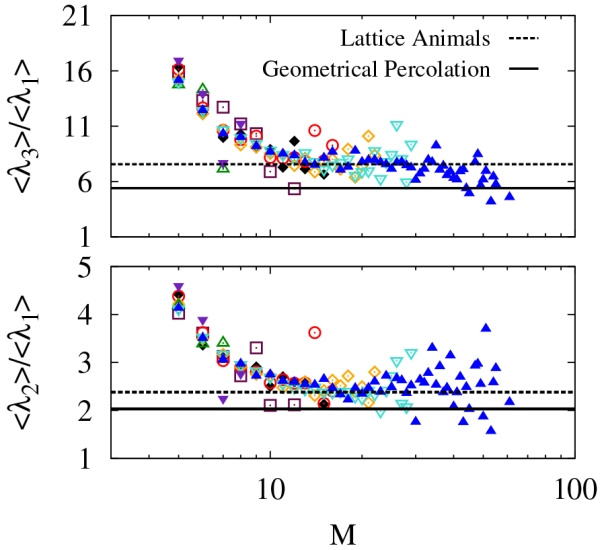
Ratios of average eigenvalues of the radius of gyration tensor for various parameters (symbols are the same as Fig. 8). The eigenvalues are sorted by magnitude such that λ1 ≤ λ2 ≤ λ3. System spanning clusters were not considered and at least five samples were required for averages.