
FIG. 12.
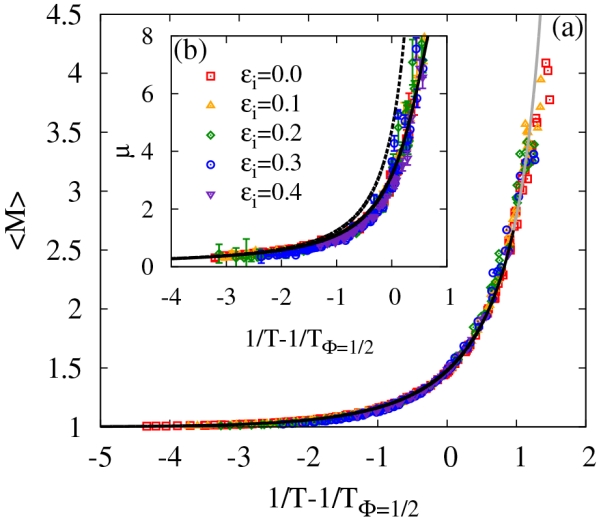
(a) Average cluster size and (b) the fitting parameter μ in geometrical percolation theory as a function of inverse temperature minus the inverse of the Φ = 1/2 polymerization transition temperature for all densities, temperatures and ϵi above the percolation transition. Points correspond to simulation data. The solid lines describe the shape of the master and master-like curves, while the dashed line represents the Flory-Stockmayer prediction of μ without any fitting parameters (see text for details). The line in gray denotes an extension of the curve beyond its range of validity.