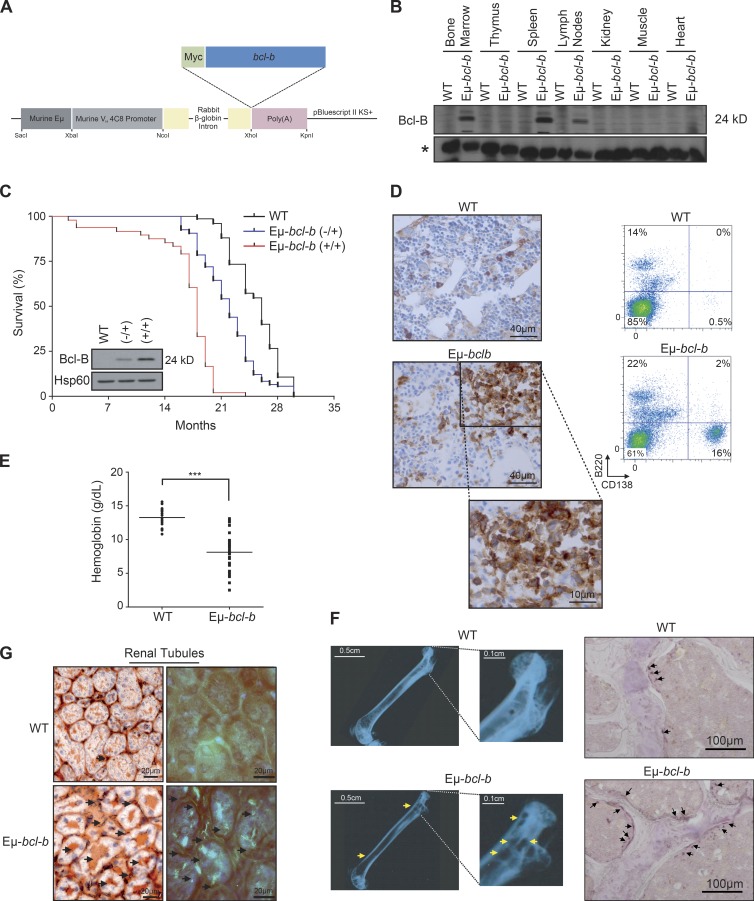
Figure 2.
Generation and characterization of Eµ-bcl-b transgenic mice. (A) Transgenic mice were designed that carry the Myc-bcl-b open reading frame under the control of the immunoglobulin VH promoter and Eµ enhancer elements (Eµ-bcl-b mice). (B) The Bcl-B protein level was analyzed by Western blot in the spleen, lymph node, thymus, BM, kidney, muscle, and heart of 8-wk-old control or Eµ-bcl-b transgenic mice. The asterisk indicates a nonspecific band used as a loading control. (C) The graph represents the overall survival (in months) of a cohort of 56 WT, 80 hemizygous (−/+), and 48 homozygous (+/+) Eµ-bcl-b mice. Statistically significant differences (P < 0.005) were detected between Eµ-bcl-b transgenic and control littermates. (inset) Splenic cells from WT, (−/+), and (+/+) Eµ-bcl-b mice were collected and lysed, and the total protein extracts were subjected to SDS-PAGE/immunoblot using Bcl-B and Hsp60 antibodies. (D, left) PCs from BM sections of hemizygous 18-mo-old WT or Eµ-bcl-b mice were stained with an anti-CD138 antibody. (right) The infiltration of PCs into the BM of transgenic mice was confirmed by flow cytometry using B220 and CD138 antibodies. (E) Hemoglobin levels in the peripheral blood were measured in 18-mo-old WT mice (n = 16) and Eµ-bcl-b mice (n = 28). ***, P < 0.0001 using a two-tailed Student’s t test for unpaired data. Horizontal bars indicate median. (F, left) Freshly isolated nondecalcified femurs from WT and hemizygous Eµ-bcl-b transgenic mice were x-rayed. The yellow arrows indicate lytic bone lesions in Eµ-bcl-b mice. (right) TRAP staining was analyzed in the trabecular zone of the femurs from WT and Eµ-bcl-b transgenic mice. The black arrows indicate more TRAP-positive osteoclasts (purple color) in Eµ-bcl-b mice. (G) Renal tissue sections from 18-mo-old control (WT) and hemizygous Eµ-bcl-b mice were stained with Congo red. (left) Sections were mounted, and brightfield images were acquired. The black arrows indicate amyloid deposition in the interstitium. (right) Polarized images were also acquired. The bright green is the “apple green birefringence” that is characteristic of amyloid.

