Figure 1.
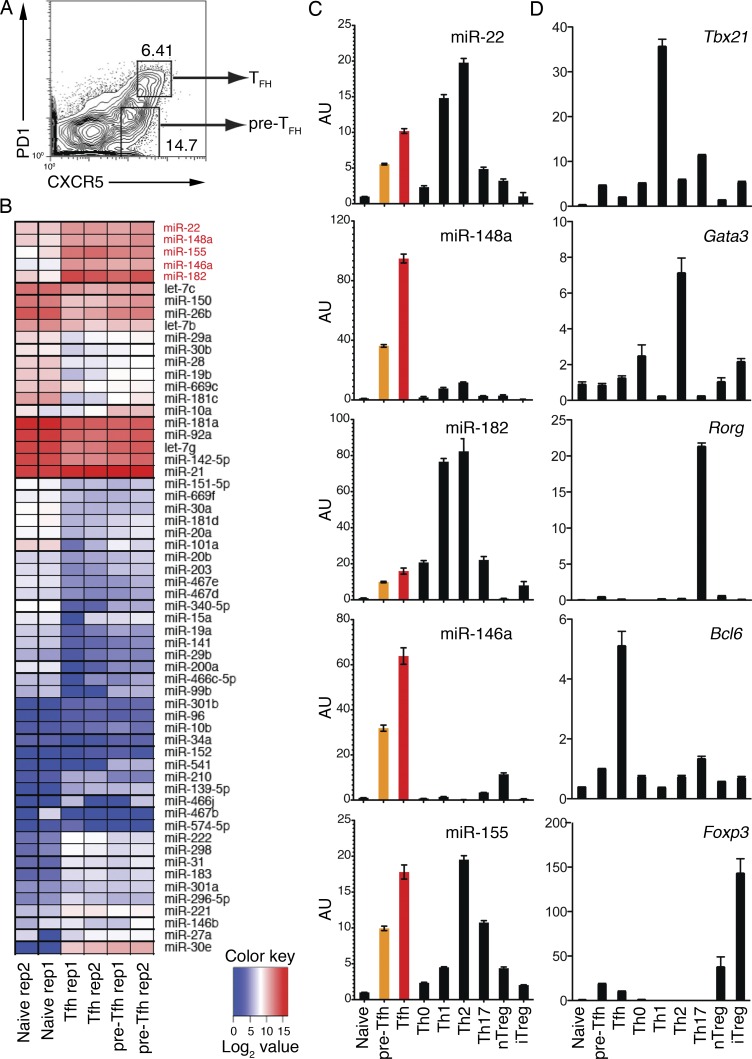
Deep sequencing analysis of miRNA expression profiles of Tfh cells. (A) FACS sorting strategy to purify CXCR5intPD1lo pre-Tfh and CXCR5hiPD1hi Tfh cells. WT C57BL/6 mice were immunized with OVA/alum/LPS, and cell subsets were sorted from splenocytes on day 7 after immunization. (B) Heat map of miRNA signatures for naive CD4+ T (CD44−CXCR5−PD1−), pre-Tfh, and Tfh cells. The color scale represents the log2 value of miRNA read counts in tags per million. The Tfh cell signature miRNAs are marked in red. See details in Table S1. (C and D) Quantitative RT-PCR analysis of individual miRNAs (C) and transcription factors (D) in naive CD4+ T, pre-Tfh, Tfh, and in vitro generated Th cell subsets and natural T reg (nTreg) cells. AU, arbitrary units. Error bars represent SD. Data are one representative result of two independent experiments and triplicate for each RT-PCR reaction.

