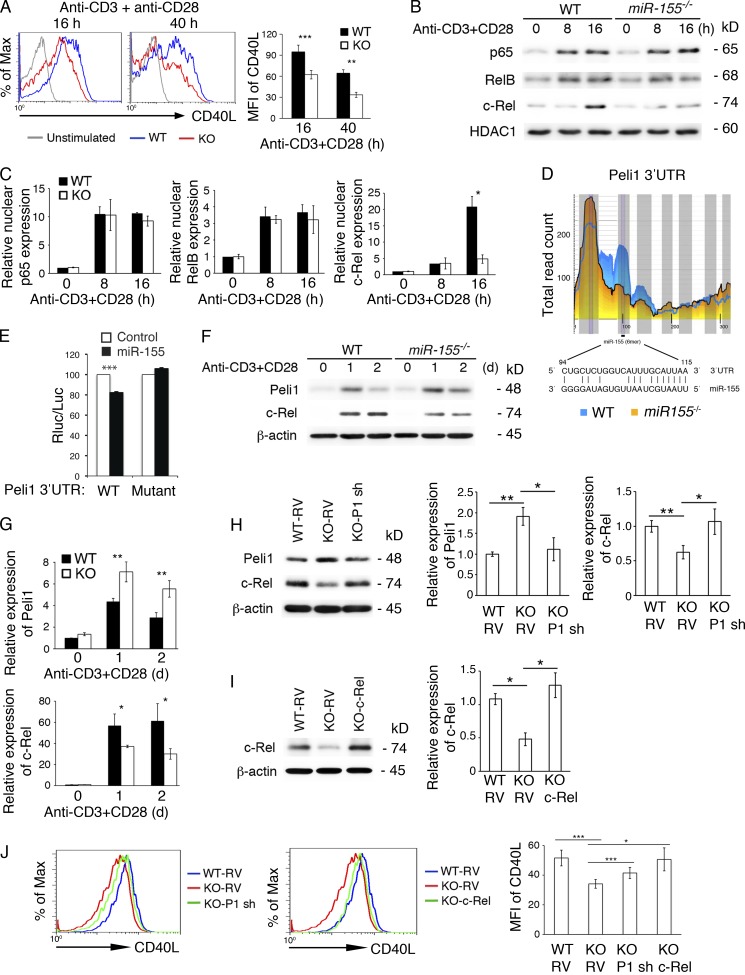
Figure 5.
miR-155 controls c-Rel and CD40L expression by targeting Peli1 in T cells. (A–J) Naive CD4+ T cells from miR-155−/− (KO) and WT mice were stimulated with 5 µg/ml anti-CD3 and 2 µg/ml anti-CD28 antibodies for the indicated amounts of time. (A) Surface expression of CD40L was analyzed by flow cytometry. The bar graph summarizes mean fluorescence intensity (MFI) of CD40L. n = 4–7 per group. (B and C) Immunoblot analysis of p65, RelB, and c-Rel in the nuclear extracts of naive CD4+ T cells from miR-155−/− (KO) and WT mice stimulated with 5 µg/ml anti-CD3 and 2 µg/ml anti-CD28 antibodies for the indicated amounts of time. Two independent immunoblot experiments were normalized by β-actin and summarized in C. (D) Schematic representation of the Peli1 3′UTR and the miR-155–binding region. The figure was adapted from CLIP base (Loeb et al., 2012). Note that Ago2 binding to the miR-155 site is much reduced in in vitro activated miR-155−/− CD4+ T cells. (E) Reporter assay of the Peli1 3′UTR fragment containing the WT or mutated miR-155–binding site. (F and G) Immunoblot analysis of Peli1, c-Rel, and β-actin expression in naive CD4+ T cells stimulated with 5 µg/ml anti-CD3 and 2 µg/ml anti-CD28 antibodies for the indicated amounts of time. Four independent immunoblot experiments were normalized by β-actin and summarized in G. (H) Immunoblot analysis of Peli1, c-Rel, and β-actin expression in WT and miR-155−/− (KO) CD4+ T cells transduced with control or Peli1 shRNA (P1 sh)–encoding RVs. (I) Immunoblot analysis of c-Rel and β-actin expression in WT and miR-155−/− (KO) CD4+ T cells transduced with control or c-Rel–encoding RVs. (H and I, left) Representative immunoblots. (Right) Bar graphs showing quantification results. (J) Flow cytometry analysis of CD40L expression on RV-transduced CD4+ T cells 1 d after retroviral transduction. The bar graph summarizes mean fluorescence intensity of CD40L. n = 5 per group. *, P < 0.05; **, P < 0.01; ***, P < 0.001 (Student’s t test). Data represent two (B, C, I, and J), three (H), and four (A, E, F, and G) independent experiments. Error bars represent SD.

