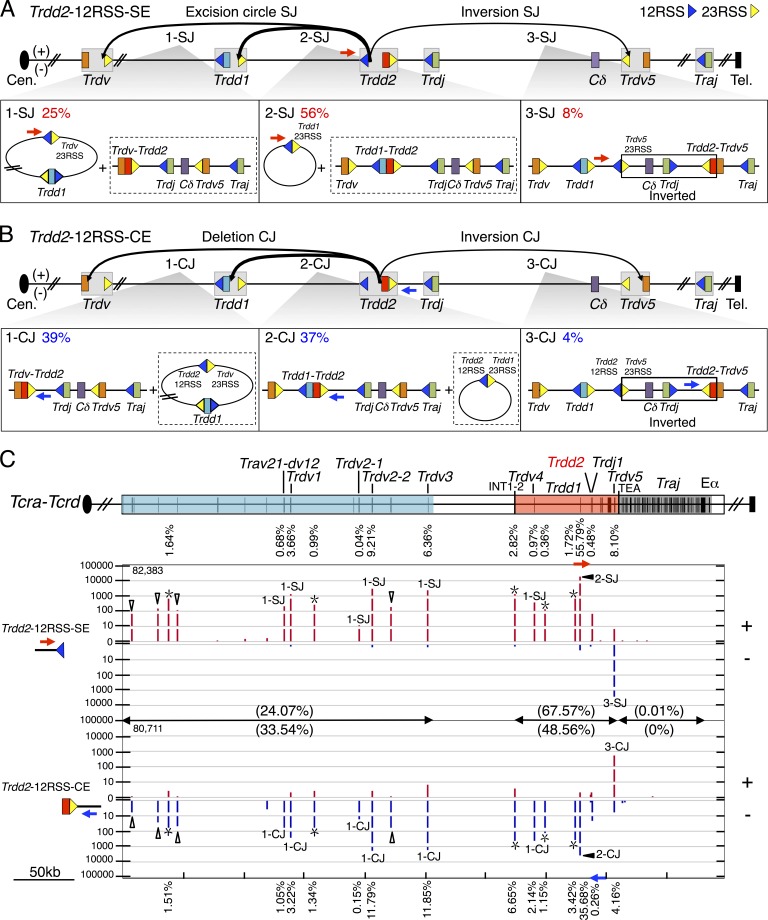
Figure 2.
Joining distribution of Trdd2-12RSS-SE and Trdd2-12RSS-CE libraries across the Tcra-Tcrd locus. (A and B, top) Predicted joining outcomes of Trdd2-12RSS-SE (A) and Trdd2-12RSS-CE (B) baits. Gray boxes indicate gene segments with their flanking RSS(s): 12RSS and 23RSS are represented by blue and yellow triangles, respectively. The used primers are labeled with blue or red arrows. (bottom) Diagram of joining outcomes in excision circles plus deletional joins (1-SJ, 2-SJ, 1-CJ, and 2-CJ); and inversional joins (3-SJ and 3-CJ). The junction percentage of such joining outcomes as of total RAG on-targets are listed in the top left corner. Associated joining outcomes not detected by the primer listed are indicated in dashed box. Inverted regions in 3-SJ and 3-CJ are boxed. (C, top) Gene segment organization of the Tcra-Tcrd locus, organized in a centromere to telomere (+) chromosomal orientation. Proximal unique Travs and Trdvs (blue), the CIL (red), and the downstream Traj cluster (dark gray) are shown. Black vertical bars in the colored regions indicate the position of gene segments. (bottom) IGV plots displaying distribution of RAG on-targets (red in + and blue in – orientations) from pooled Trdd2-12RSS-SE (n = 4) and -CE libraries (n = 3). Junctions are displayed as stacked tracks (i.e., log scale between tracks, linear scale within each track) with the total number of RAG on-targets for the bait used are listed in the top left corner. Junction percentages for each indicated gene segment are labeled above or below their corresponding junction peaks. Open triangles mark Trav junctions and asterisks indicate δREC (δREC1, δREC2, δREC3, δREC4, and δREC5 from centromere to telomere). Junction percentages for each region are denoted in parentheses. Trdd2-12RSS-SE and -CE libraries are normalized to 83,572 total junctions.

