Figure 6.
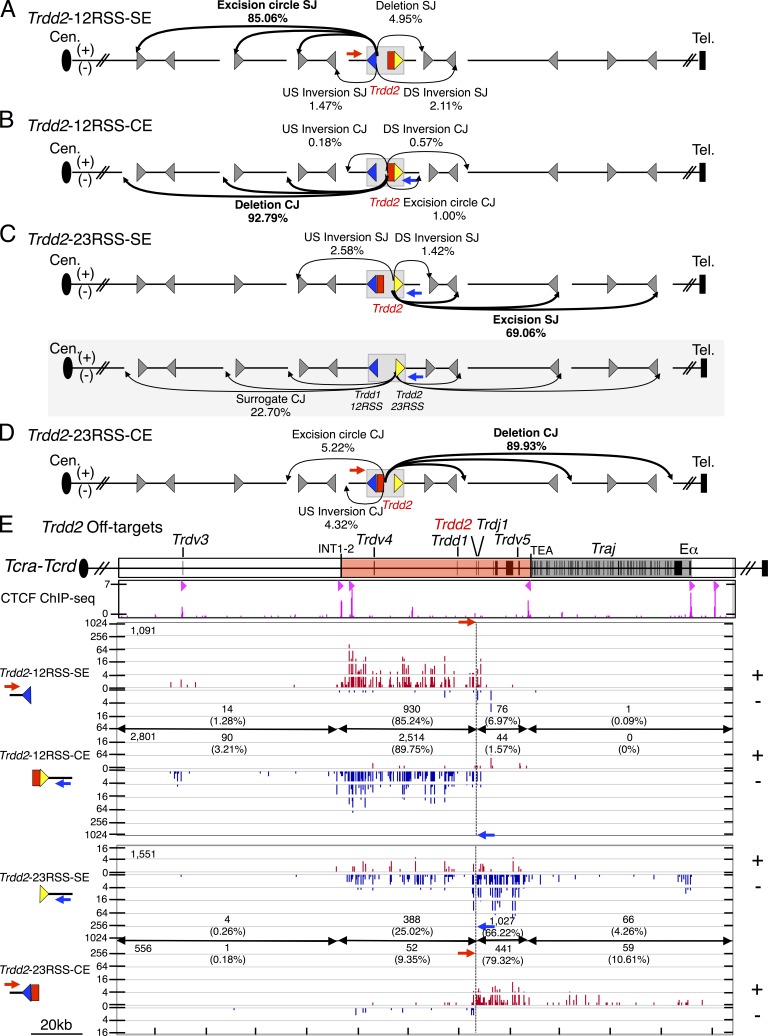
Direction- and orientation-specific off-target joining of RAG-initiated Trdd2 rearrangements. (A–D) Joining outcomes to cRSS (CAC) sites (gray triangle) from Trdd2-12RSS-SE (n = 4; A), -CE (n = 3; B), Trdd2-23RSS-SE (n = 3; C), and -CE (n = 4; D) libraries. Diagram of joining outcomes from Trdd2-23RSS-SE bait in the fused Trdd1-12RSS/Trdd2-23RSS configuration to cRSSs is shaded in gray (C). Junction percentages as of total RAG off-targets in excision circle, deletion, upstream (US) inversion, and downstream (DS) inversion joining events are shown. Red and blue arrows indicate the position and orientation of 5′- and 3′-Primers, respectively. Dotted line indicates the position of bait BEs. (E, top) Gene segment organization of the region between Trdv3 and Eα (3′ portion of the Tcra-Tcrd locus). CIL (red) and Traj cluster (dark gray) are indicated. (middle) ChIP-seq profile of CTCF. CBE orientation is marked by light red triangles. (bottom) IGV plots of RAG off-target joining patterns of Trdd2-12RSS-SE and -CE and Trdd2-23RSS-SE and -CE libraries. The total number of RAG off-targets is displayed on the top left corner of each plot. Junction numbers and percentages as of total RAG off-targets in indicated regions are shown.

