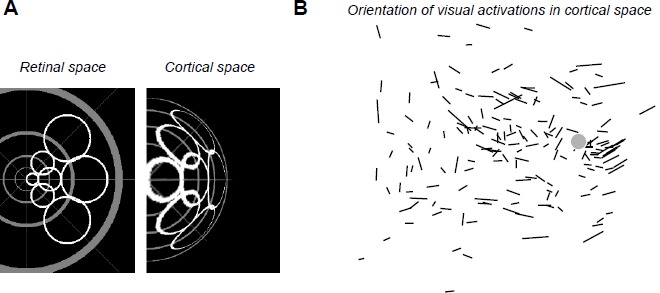
Author response image 3.

(A) Simulated deformation of cortical activations (right) to circular retinal regions located at various eccentricities and angles (left), the center of the gray pattern corresponding to the optic disk location. For this simulation, we used our estimation of the retino-cortical magnification factor. (B) Orientations of visual activations on the cortical surface. Length of the segments is proportional to the aspect ratio of the activation. Gray disk represents the median blind spot representation, scale bar: 0.5mm.
