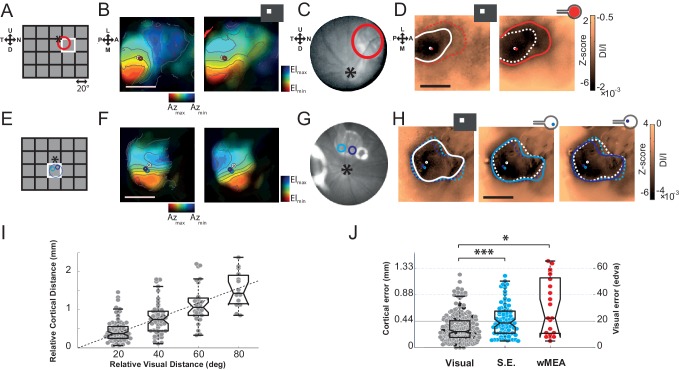
Figure 2. Position.
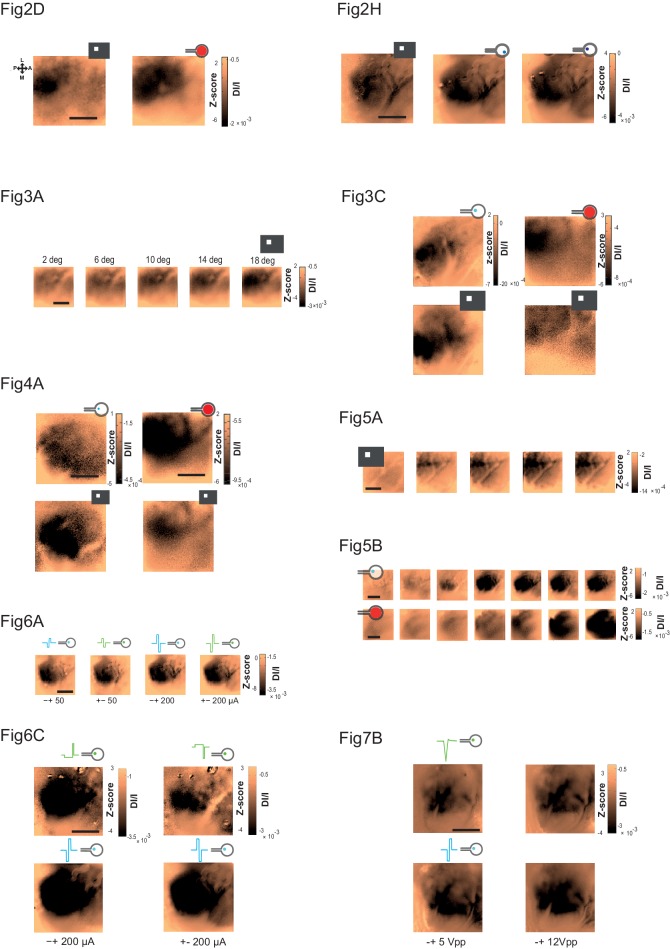
The visual (A&E), retinal (C&G) and cortical (B,D&F,H) expected position and size of the MEA are compared to their corresponding visual stimuli. (A) Schematic view of the visual field showing the 20 positions (grid) of the visual stimuli used for retinotopic mapping. Optic disk: asterix; MEA: colored circles; nearest visual stimulus: white square (stands for all Figures). (B) V1 retinotopic polar map for azimuth (left) and elevation (right). Color hue and brightness code respectively for the retinotopic position and the strength of the response. Scale bar: 2 mm. (C) Image of the eye fundus with the implant. (D) Extent and center-of-mass (contour and circle respectively) of V1 activations generated by visual (white, right map) and stimulation at ± 150 µA wMEA (red, left map). The activation amplitude depicted in the colorbar is expressed both in Z-score and in DI/I (see Materials and methods). The solid line indicates the activation contour of the corresponding map and the superimposed dashed line corresponds to the compared condition; scale bar: 2 mm. (E-H) Same as in (A-D) in a different animal for 2 SE stimulations (cyan and purple; dashed circle: MEA position) at ± 200 µA; see Figure 6A for an example at low intensity in the same animal. (I) Retino-cortical magnification factor for azimuth computed over 20 animals (n = 177 displacements). Boxplots represent the median and interquartile range; whiskers represent ± 2.7σ or 99.3 coverage if data are normally distributed (any points outside are considered as outliers). (J) Retinotopic based positional cortical error for visual and electrical activations (right: mm; left: equivalent degrees of visual angle). Black dots correspond to visual counterparts of electrical activations. One-sided two-sample Wilcoxon rank sum test for paired data: pSE vs. wMEA=0.056, nwMEA = 21, nSE = 82, NwMEA = 6, NSE = 7. Wilcoxon rank sum test for paired data: *p=0.025, n = 13, N = 4 and ***p=5.35 10–5, n = 80, N = 6 (*p<0.05, **p<0.01, ***p<0.001, n = number of sample, N = number of rats).


