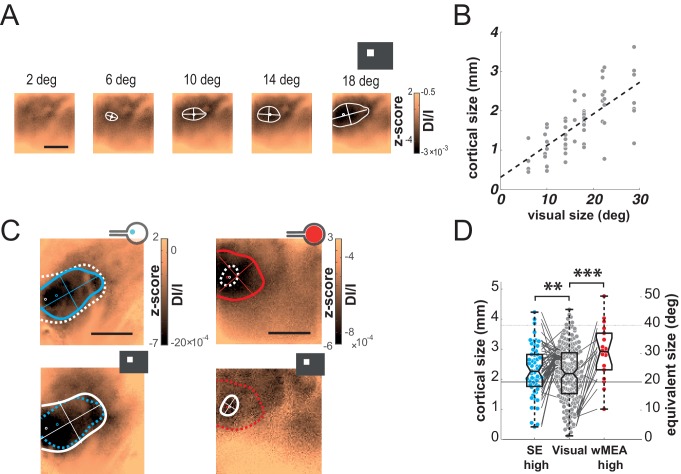
Figure 3. Size.
(A) V1 activation generated by visual stimuli of increasing size (value indicated above the maps). Center-of-mass: white circle; extent: white contour; equivalent ellipse orientation: white cross; scale bar: 2 mm. (B) Extent of cortical activation as a function of visual stimulus size pooled over 7 rats (linear fit: dashed black line). (C) Extent of cortical activations generated in 2 animals by SE (blue) and wMEA (red) stimulation (top maps) at a high current intensity (± 200 and 150 µA respectively) and their corresponding 20° visual stimulus (white, bottom maps). Centers of mass of the activation: colored circles; scale bar: 2 mm. (D) Size of cortical activation generated by visual (gray, N = 20 rats); SE (blue, N = 8 rats) and wMEA (red, N = 10 rats) stimulation. Wilcoxon rank sum test for paired data: **p=0.0019 (n = 54, N = 8), ***p=1.83 10–4 (n = 15, N = 10). An alternative ordinate of equivalent visual counterpart is given on the right. Gray thin lines link paired electrical stimulation to visual activation. Solid horizontal black line indicates the size of a 20° visual stimulus estimated from the fit in B. Note that we could not reveal any effect of the electrode-to-counter-electrode distance on activation size in the various SE configurations (not shown).

