
Figure 4. Shape.
(A) Shape of cortical activations generated in 2 animals by SE (blue) and wMEA (red) stimulation at high current intensity (top) and their corresponding 20° visual stimulus (white, bottom). (B) Aspect ratio (AR) of cortical activations (Wilcoxon rank sum test for paired data, ***p=1.06 10–4, n = 44, N = 7). (C) Predictions of the elongation of electrical activations as a function of the contribution of axons en passant and the distance to the optic disk. Insets correspond to a model of retinal activation due to direct isotropic activation plus passive electrical diffusion and anisotropic activation due to axons en passant recruitment for 3 different electrode sizes. The brightness codes the strength of the response. Center of the white dashed target: position of the optic disk; black circle: position and size of the MEA active surface; gray lines: 'shadow cone' angle sustained by the MEA active surface respective to the optic disk location; colored contour: size and shape of the global retinal activation for an axons en passant contribution of 1 (alpha, see Materials and methods). (D) Elongation of electrical activations relative to their corresponding visual activations (AR electrical/AR visual) as a function of the 'shadow cone' angle. (E) Cortical radial organization of prosthetic activations. Solid segments: orientation of cortical activations; dashed segments: optimal radial orientation towards the black disk; segment crossing; geometrical center; red dot: center-of-mass of cortical activations; Dark disk: cortical position that optimized radial organization; gray disk: median position of the optic disk. The blue lines connect the center-of-mass to the geometrical center of activations. Scale bar: 0.5 mm. Inset: distribution of median angular deviation expected by chance compare to our observation: blue segment. (F) Top: centered and reoriented deviations of the center-of-mass (blue disks) to the geometrical center (center of the representation), horizontal dashed axis corresponds to the orientation of the radial organization. Bottom: averaged, centered and reoriented SE (with AR > and < than 1.6, left and middle respectively) and wMEA maps (right). White circle: center-of-mass; additional dashed contour corresponds to a Z-score of −4.5.

Figure 4—figure supplement 1. Model of retinal anisotropic activation.
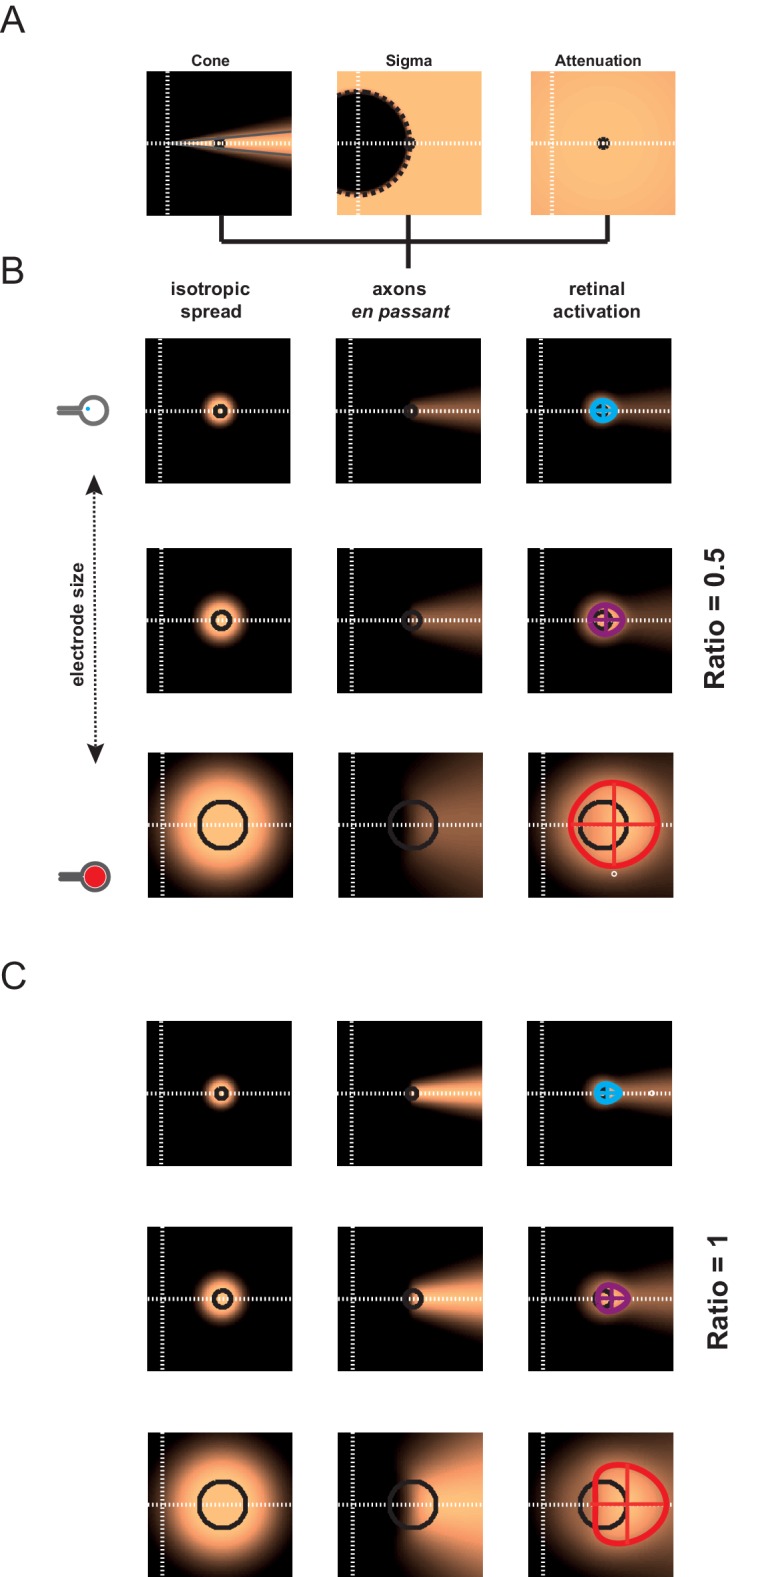
Figure 4—figure supplement 2. Model of retino-cortical transformation.
