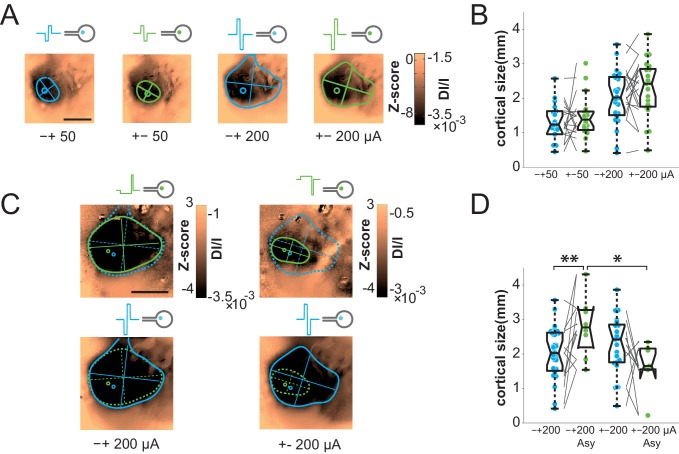
Figure 6. Focalization.
(A) SE activations generated by square pulses of different polarity (anodic first: blue; cathodic first: green) at 2 intensity levels (50 and 200 µA). Scale bar: 2 mm. (B) Effect of polarity and intensity on cortical extent for SE (anodic first: blue; cathodic first: green, N = 10). One-sided Wilcoxon rank sum test for paired data, p=0.3802 (n = 18, N = 10) and 0.0615 (n = 11, N = 10) for 50 and 200 µA respectively. (C) Individual example of asymmetrical (green) and symmetrical (blue) square pulses, same animal as in (A). (D) Effect of square pulse asymmetry (green) for two polarities on cortical extent for SE (N = 10). One-sided Wilcoxon rank sum test for paired data: **pCathoSym vs. CathoAsy=0.0052 (n = 13, N = 10); *pAnoAsy vs. CathoAsy=0.0469 (n = 6, N = 10).

