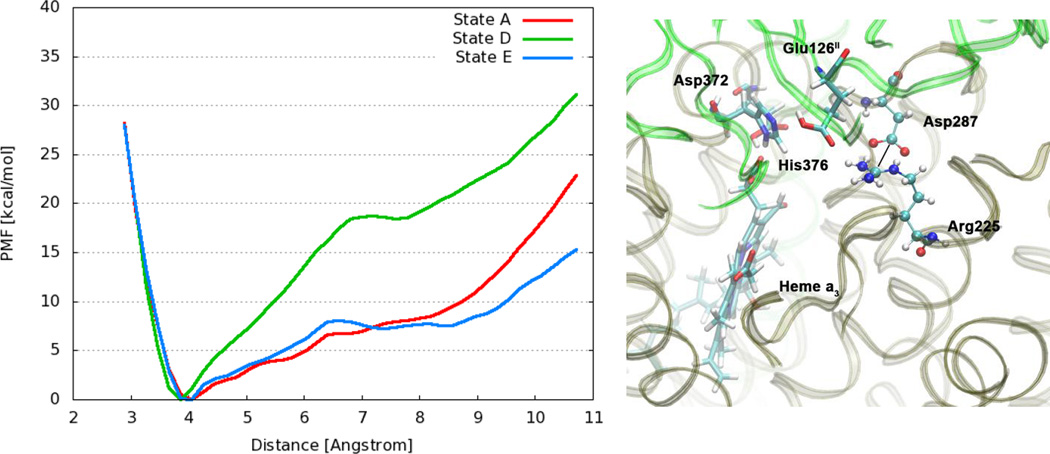
Figure 4.
Left: Free energy profiles for the salt bridge Arg225–Asp287 in different protonation states of CcO. The distance is measured between the carbon atom Cζ of the guanidinium group in Arg225 and the carbon atom Cγ of the carboxylate group in Asp287. (Dotted line) Right: Snapshot from a simulation of state E with protonated Glu126II, highlighting relevant residues.

