Figure 5.
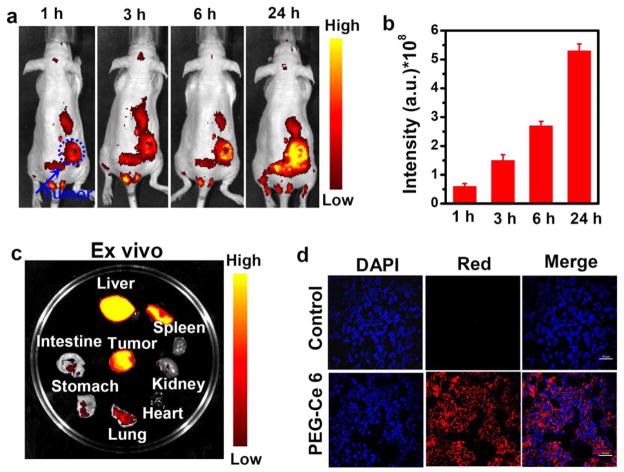
In vivo and ex vivo fluorescence imaging. (a) In vivo fluorescence images of 4T1 tumor-bearing nude mice taken at different time points post i.v. injection of PEG-Ce 6 nanomicelles. Tumors are indicated by blue arrowheads. (b) Relative fluorescence intensities of the tumors at different time intervals based on in vivo fluorescence images shown in (a), n = 3. (c) Ex vivo fluorescence images of major organs and tumor dissected from mice injected with PEG-Ce 6 nanomicelles at 24 h p.i.. (d) Confocal images of tumor tissues after i.v. injection PEG-Ce 6 nanomicelles or not at 24 h p.i.. Red color represents the fluorescence signal from Ce 6. The scale bar is 10 μm.

