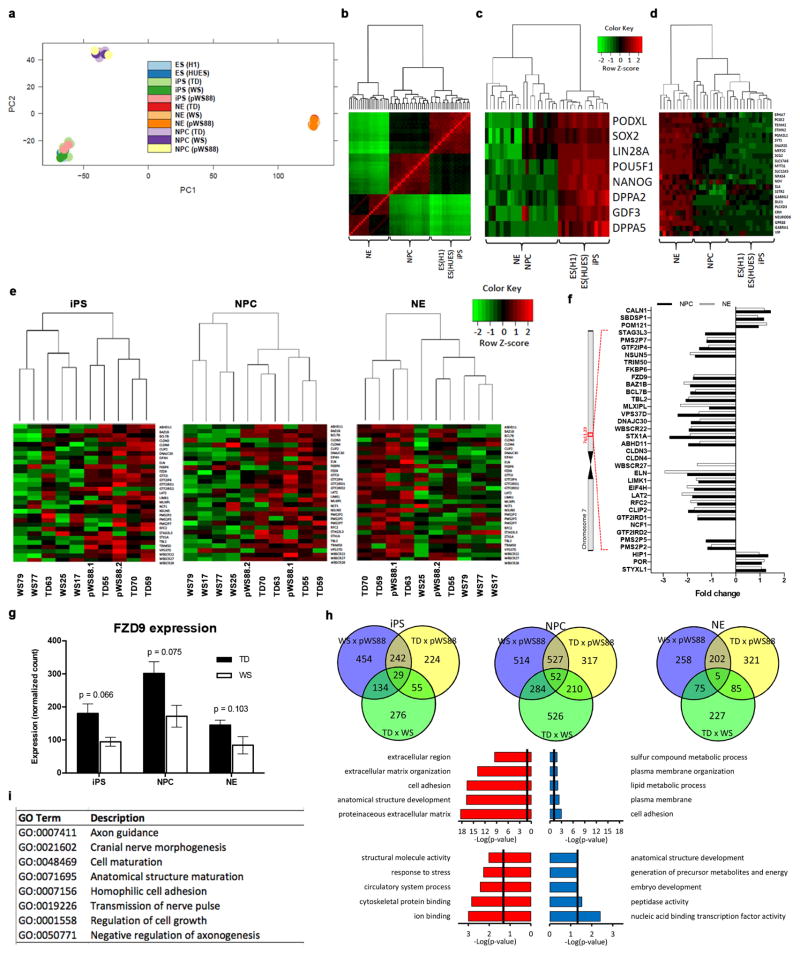
Extended Data Figure 3. Global gene expression analysis during neuronal differentiation.
a, Principal component (PC) analysis plot of embryonic stem cells (ES), induced pluripotent stem cells (iPS), neuronal progenitor cells (NPC) and neurons (NE) for TD, WS and pWS88. c, Euclidian matrix distance-based heatmap and hierarchical clustering-based dendrogram of ES, NPC and NE cells for WD, WS and pWS88 samples. Expression variability between samples is indicated by Z-score, varying from green (negative variation) to red (positive variation). c, Euclidian matrix distance-based heatmap and hierarchical clustering-based dendrogram of pluripotency gene markers for ES, NPC and NE cells for TD, WS and pWS88 samples. d, Euclidian matrix distance-based heatmap and hierarchical clustering-based dendrogram of neuronal gene markers for iPS, NPC and NE cells for TD, WS and pWS88 samples. Expression variability between samples is indicated by Z-score, varying from green (negative variation) to red (positive variation). e, Specific cell type-based clustering analysis of biological replicates subjected to RNA-seq for the WS-related genes in three stages during differentiation (iPS, NPC and NE). f, Fold change variation of WS-related genes in different cell lines. Ideogram of chromosome 7 (band 7q11.23) corresponding to the commonly deleted region with the WS-related genes. Fold change variation of normalized WS-related gene expression in NPCs and neurons (NE) compared to TDs. Non-represented fold change corresponds to those genes having high expression variability between biological replicates, or having very low expression values. g, Expression of FZD9 gene in iPSC, NPCs and neurons from TD and WS. Error bars are represented by standard error. h, Venn diagram showing correlation of significant differentially expressed genes between TD, pWS88 and WS during neuronal differentiation. Significantly enriched GO terms found for down-regulated (red histogram) and up-regulated (blue histogram) differentially expressed genes between TD and WS in NPC. Significantly enriched GO terms found for down-regulated (red histogram) and up-regulated (blue histogram) differentially expressed genes between TD and WS in neurons (NE). Vertical line (black) corresponds to significant p-value (0.05). i, Enriched GO metabolic process terms found in NPC of WS samples correlated with the GO found by a similar comparison performed by Adamo et al. (2014)13.

