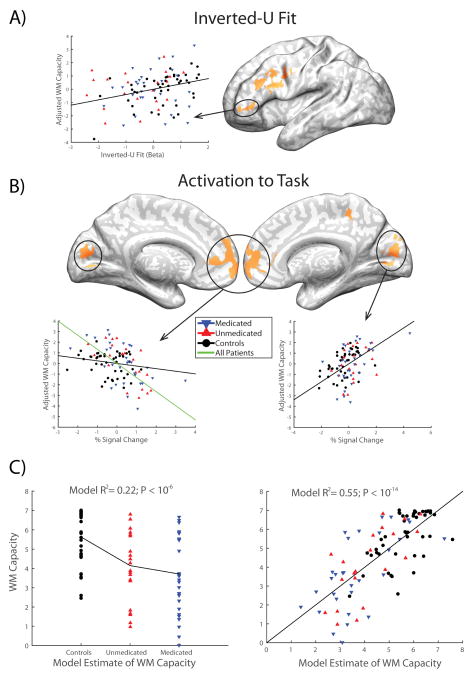
Figure 4. Brain regions showing group differences and an association with working memory for either inverted-U fit or task activation.
A) Regions in a whole-brain analysis showing both a significant difference between patients and controls and an association with working memory capacity in at least one group for the inverted-U fit. B) Regions in a whole-brain analysis showing both a significant difference between patients and controls and an association with working memory capacity in at least one group for activation to the self-ordered working memory task. Scatter plots in both A) and B) show the relationship between the circled region and working memory capacity, after adjusting working memory capacity for other predictors in the full model described in the main text. C) Working memory capacity regressions for a simple model including only diagnostic and medication grouping variables (left) and for a full model determined with step-forward model selection (right), including the four circled regions identified in panels A) and B).

