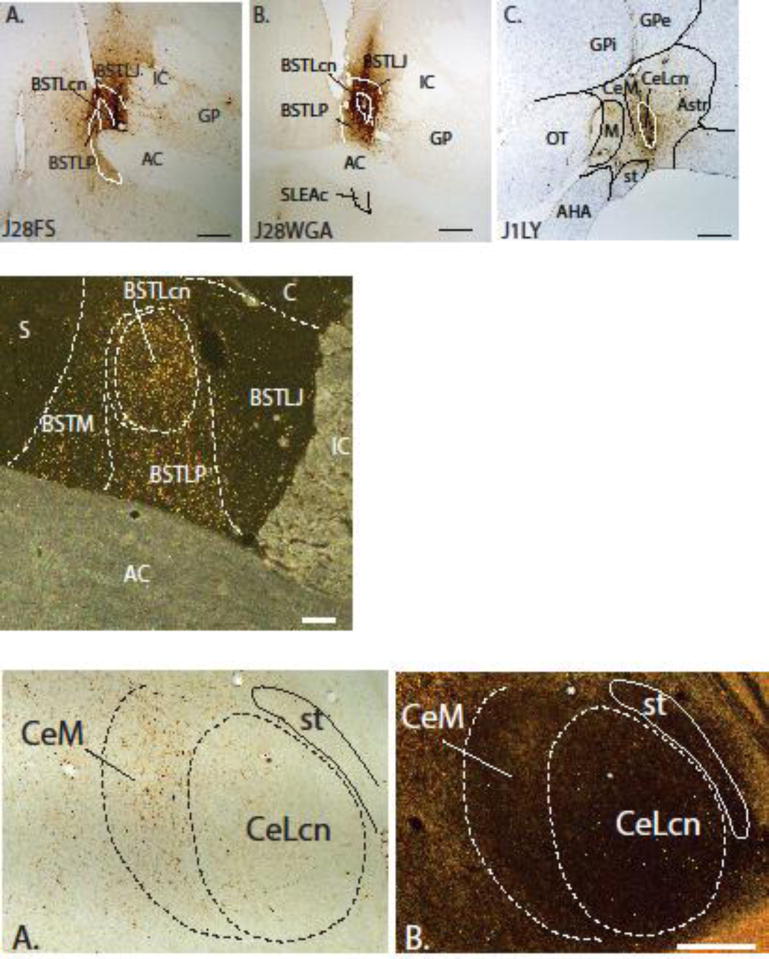
Figure 3.
Row 1, A & B: Photomicrographs of representative injections into the BSTL (J28FS and J28WGA). Nuclear subdivisions were determined from adjacent sections stained for AChE. Case J28FS is centered on the BSTLJ and Case J28WGA is centered on the BSTLcn. C: A photomicrograph of an injection into the CeLcn (Case J1LY) with light cresyl violet counterstain. Note that the gliotic scar dorsal to injections site is due to DAB stain; there is no tracer uptake there. Scale bar = 1 mm. Row 2. Photomicrograph under dark-field illumination showing the distribution of labeled fibers in the BSTL subdivisions resulting from Case J9LY Scale bar = 500μm. Row 3, A. A brightfield image of retrogradely labeled cells in the CeN subdivisions following an injection in the BSTL (Case J24FS). B. A darkfield image of an adjacent section stained with AChE to determine Ce subdivisions. The asterisks show nearby blood vessel landmarks. Scale bar = 500μm.

