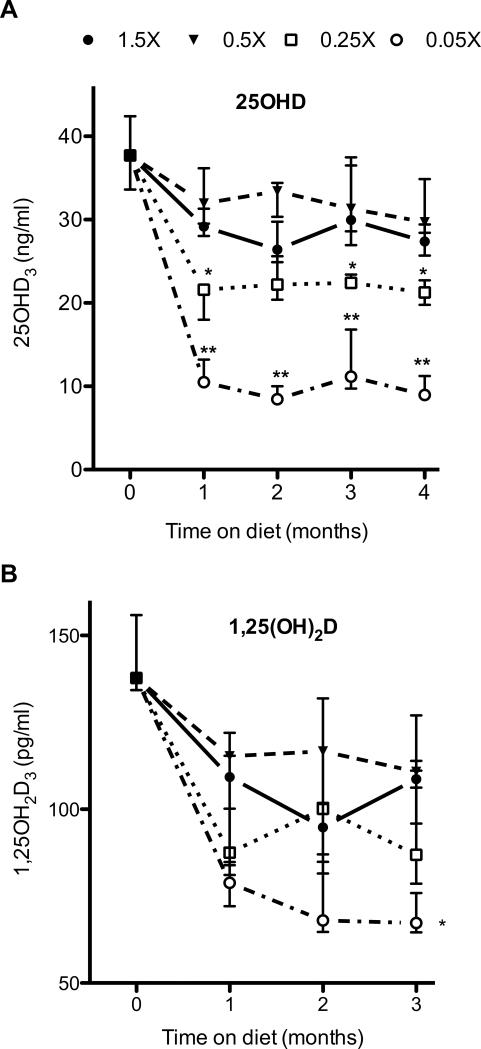
Figure 2.
Effect of dietary cholecalciferol content on (A) serum 25OHD concentrations and (B) serum 1,25OH2D concentrations. Mice were fed with the indicated diets and blood was collected at monthly intervals. Symbols and error bars represent median ± interquartile range, *p ≤ 0.05, *p≤0.001, compared with 1.5X and 0.5X diets. For the 25OHD levels, n=27 for 0 months, and 8 to 10 mice per dietary group for months 1 to 4. For the 1,25OH2D levels, n=12 for 0 months, and 9 mice per dietary group for months 1 to 3.

