. 2016 Jul 1;2(4):247–254. doi: 10.1192/bjpo.bp.115.002493

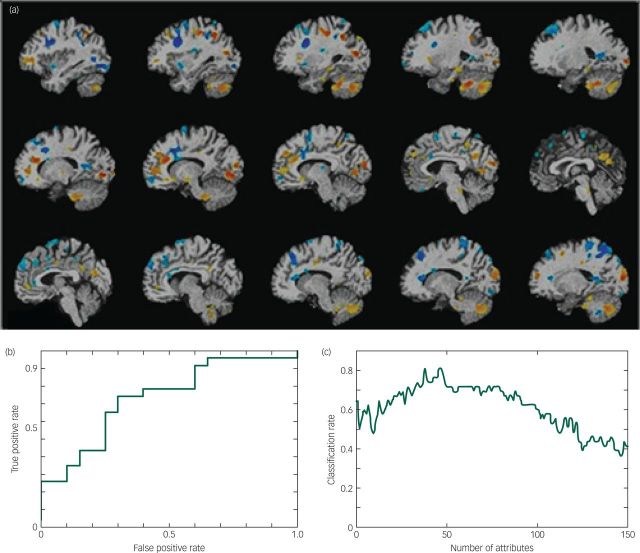
Fig. 2. (a) Schematic map showing white matter regions which contributed towards diagnostic classification of MDD, regions are presented at P<0.05 uncorrected. Blue indicates regions showing atrophy in MDD patients relative to controls and yellow indicates regions of greater volume in MDD patients compared with healthy controls. (b) Receiver operating characterstic (ROC) curve for the comparison between MDD and healthy participants, area under curve (AUC)=0.73, P=0.02. The x-axis is the false positive rate (1-specificity) and the y-axis is the true positive rate (sensitivity). (c) Graph illustrating change in classification rate with number of attributes selected. The x-axis indicates the number of attributes and the y-axis the classification rate. The highest classification rate was 81.4% based on 47 features, while the most stable pattern was observed with an accuracy of around 70% based on 50–70 features.

Fig. 2