. 2016 Jun 3;2(3):210–216. doi: 10.1192/bjpo.bp.116.002741

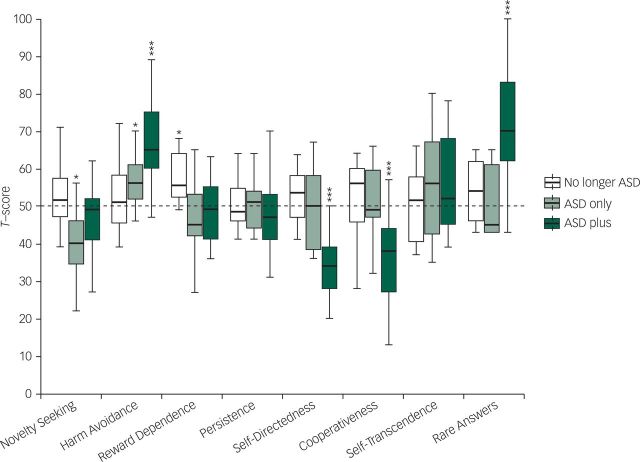
Fig. 1. Temperament and character dimensions compared with norm data with a one-sample t-test, presented in a Tukey boxplot. The boxplot represents medians (line in box), 25th and 75th quartiles (outer lines of box) and 1.5 IQR above and below quartiles (end of whiskers). The statistical analysis was based on means, but boxplots were presented to better represent the variance of the data. Outliers have been removed to enhance readability (there were no extreme outliers). In the ASD only group, there were two outliers, one below regarding reward dependence and one below regarding cooperativeness. In the no longer ASD group, there was one outlier below regarding self-directedness and in the ASD plus group there was one outlier above regarding self-directedness. *= significant difference from norm data at P<0.05; **= significant difference from norm data at P<0.01; *** significant difference from norm data at P<0.001.

Fig. 1