Figure 1.
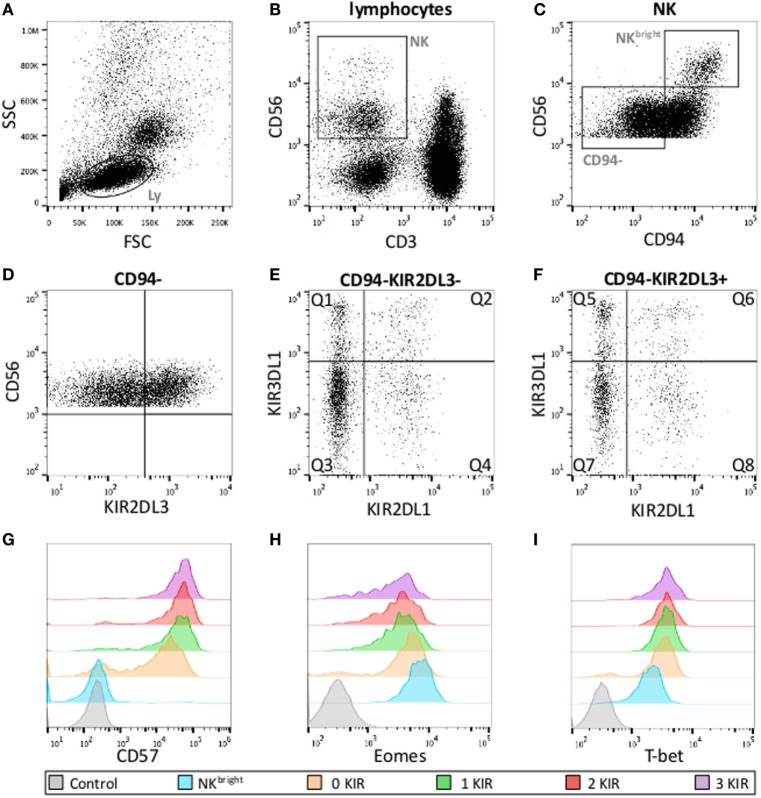
Gating strategies for KIR subset analysis. (A) Lymphocyte gates on FSC and SSC. (B) NK cell defined as CD56posCD3neg lymphocytes. (C) CD56bright and CD56dim NK cells according to the level of CD56-expression and gate on CD56dimCD94neg NK cells used for further analysis. (D–F) CD56dimCD94neg cells according to KIR expression (eight subsets). Q1: KIR2DL1negKIR2DL3negKIR3DL1pos, Q2: KIR2DL1posKIR2DL3negKIR3DL1pos, Q3: KIR2DL1negKIR2DL3negKIR3DL1neg, Q4: KIR2DL1posKIR2DL3negKIR3DL1neg, Q5: KIR2DL1negKIR2DL3posKIR3DL1pos, Q6: KIR2DL1posKIR2DL3posKIR3DL1pos, Q7: KIR2DL1negKIR2DL3posKIR3DL1neg, Q8: KIR2DL1posKIR2DL3posKIR3DL1neg. Examples of fluorescence intensity of CD57 (G), Eomes (H) and T-bet (I) according to the number of KIR expressed with their respective negative controls.

