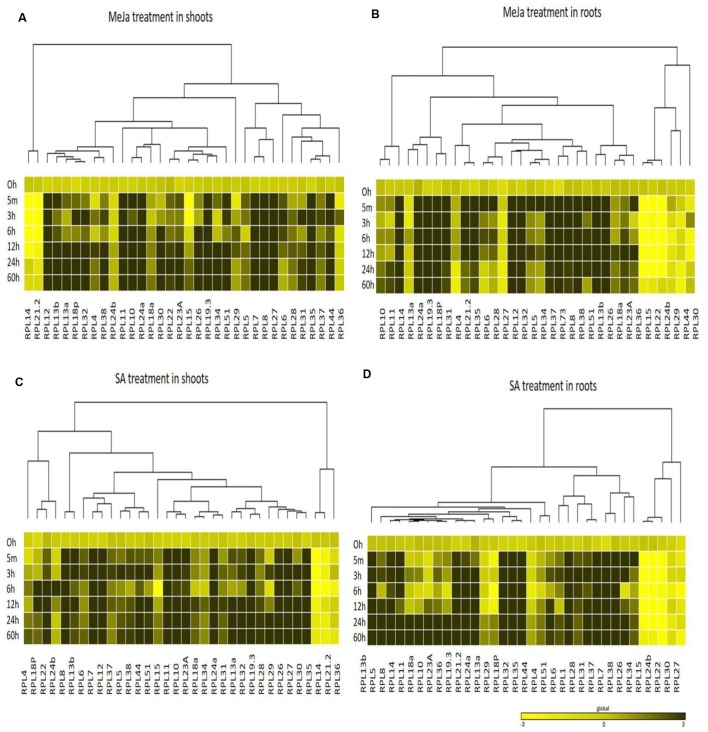
FIGURE 4.
Heat map representation of RPL genes in rice treated with MeJa and SA. Seven-day-old rice seedlings were exposed to different abiotic stresses such as MeJa; 100 μM (A,B) and SA; 3 mM (C,D) at six different time points as indicated on the left. The qRT-PCR is used to determine the expression levels of RPL genes and the fold change was normalized using ΔΔCT method relative to that in unstressed seedlings dipped in water at corresponding time points. Rice actin (act1) and β-tub genes were used as internal controls. Three biological replicates and two technical replicates were included in the study. A dendrogram was constructed to represent the Hierarchical clustering of genes.

