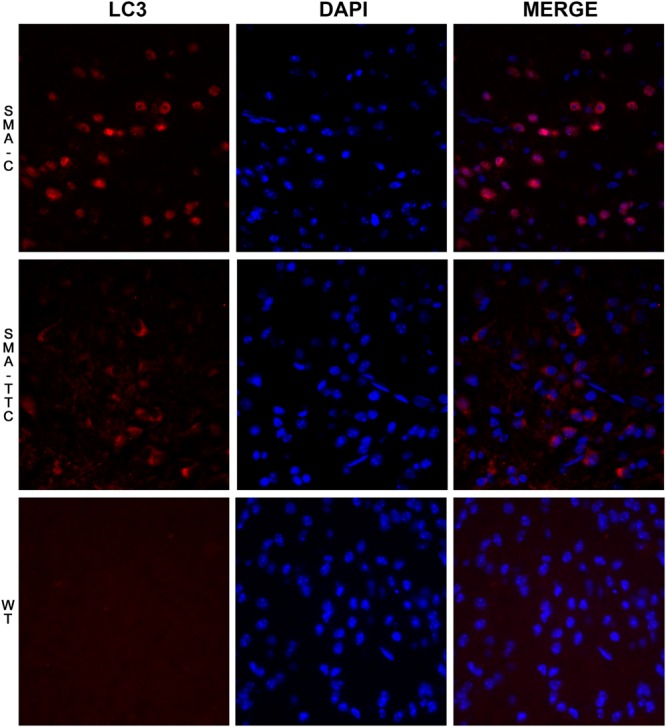
FIGURE 3.

Immunofluorescence staining for LC3 on spinal cord tissue under TTC treatment. LC3 staining (red) was performed in WT mice and SMA mice untreated and treated with TTC in spinal cord slices. DAPI staining was also performed (blue). A merged image of the double staining is presented. A representative image presents of three independent animals for genotype and disease stages (40X).
