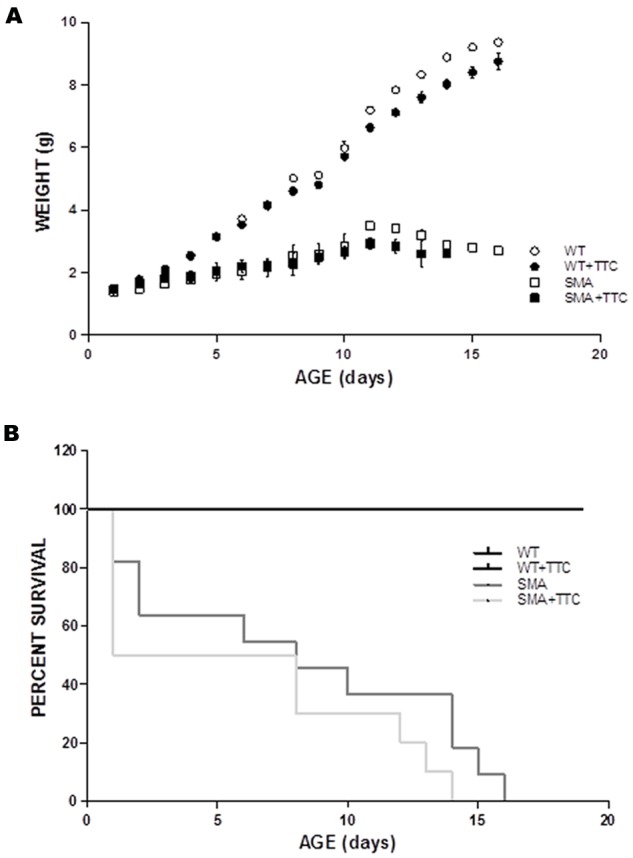
FIGURE 5.

Phenotype and survival time of treated and untreated SMA mice. (A) Weight curves of WT (circles) and SMA mice (squares) treat (closed forms) and untreat (open forms) with TTC. All plots are shown as means of weight at each day with error bars representing standard deviation. ∗p < 0.05. (B) Kaplan–Meier survival analysis of WT and SMA mice with and without TTC treatment.
