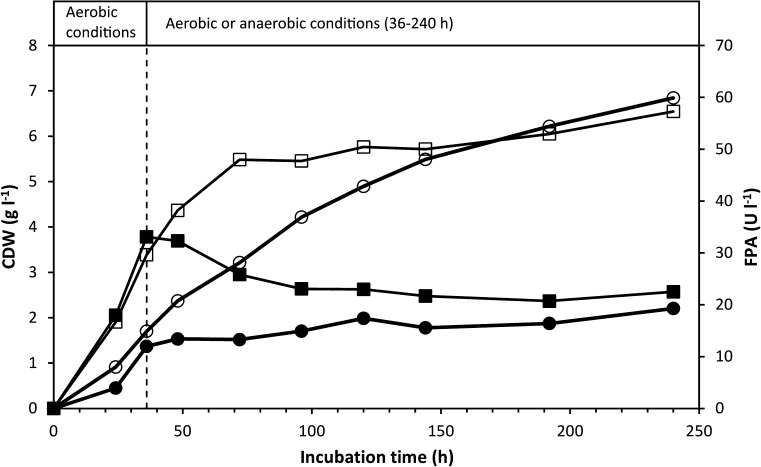
Fig. 3.
CDW (calculated from ammonium assimilation) and FPA levels in cultures of C. uda grown on α-cellulose (20 g l−1) under aerobic conditions (‘Aerobic’) or grown under aerobic conditions for the first 36 h, followed by anaerobic conditions (‘Anaerobic’). The broken vertical line indicates the switch to anaerobic conditions in ‘Anaerobic’. FPA levels below the detection limit are shown as zero. The experiment is the same as in Fig. 2. Symbols: (open circle) CDW ‘Aerobic’, (filled circle) CDW ‘Anaerobic’, (open square) FPA ‘Aerobic’ and (filled square) FPA ‘Anaerobic’

