
Figure 3.
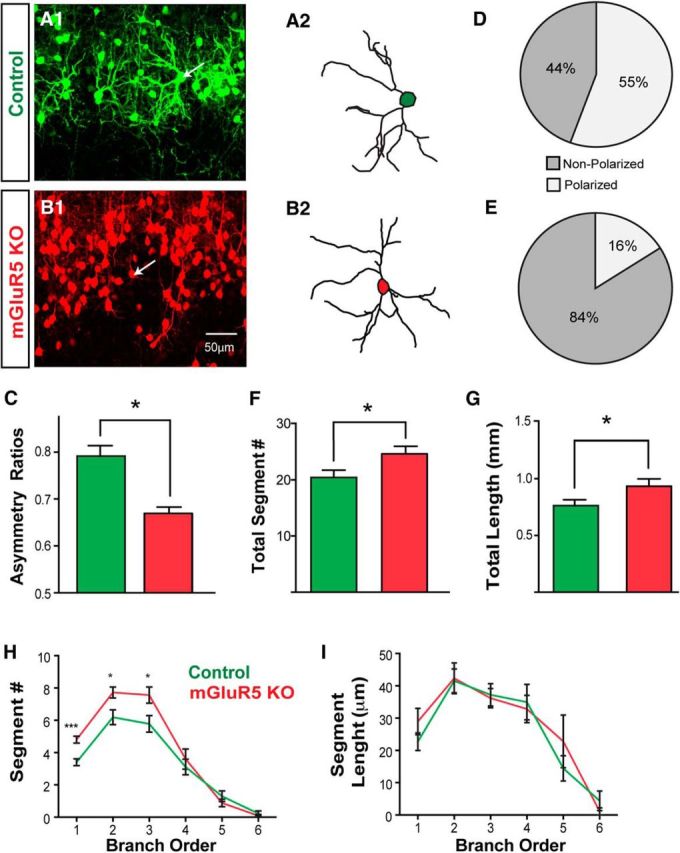
Defective dendritic morphogenesis in mGluR5 KO neurons. A, An example projected image from confocal image stacks shows GFP-labeled control neurons projecting their dendrites toward the center of the barrel hollow (A1). The reconstructed morphology of the neuron is identified by the white arrow (A2). B, Example projected images from confocal image stacks show TdTomato-positive mGluR5 KO neuron (B1). The indicated neuron (white arrow) was reconstructed to show its dendritic morphology (B2). C, Summary of dendritic asymmetry ratios, calculated from polar histograms (see Materials and Methods). D, E, Pie charts show the percentage of control (D) or mGluR5 KO (E) neurons that are polarized or nonpolarized (neurons with a dendritic asymmetry value >0.75 were considered to be polarized). F–I, Dendritic morphologies of control and mGluR5 KO neurons were quantitatively compared with the number of total segments (F), total dendritic length (G), the average segment number per branch order (H), and the average segment length per branch order (I). The asterisks represent significant differences from the control group (*p < 0.05, ***p < 0.001, t test). Scale bar, 50 μm.