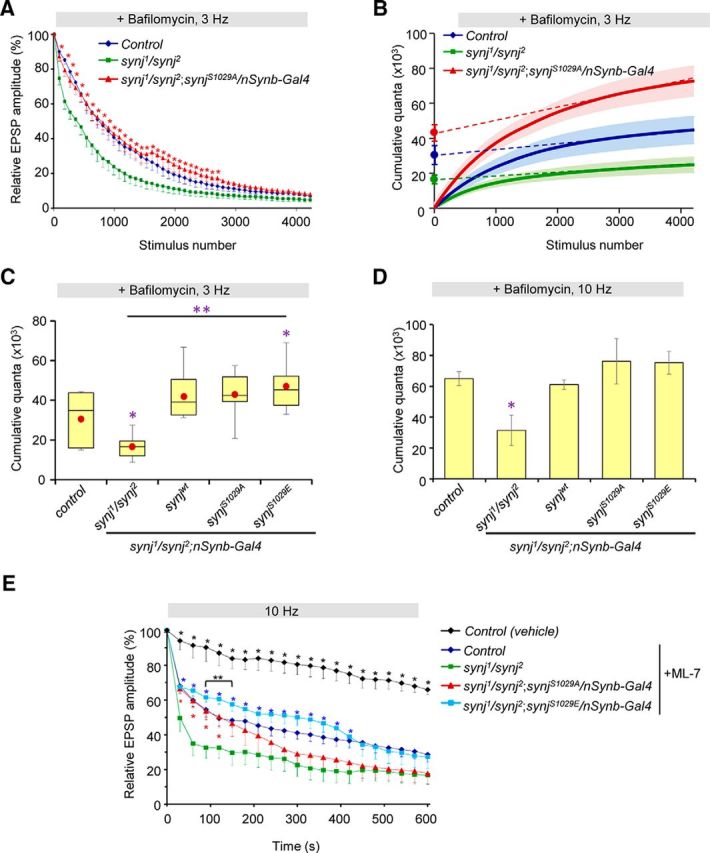
Figure 6.

Phosphorylation of Synaptojanin differentially affects the size of the ECP and RP. A, Relative EPSP amplitude plotted over time for indicated genotypes in the presence of 2 μm bafilomycin A1 with 3 Hz stimulation. Expression of the phospho-null SynjS1029A restores the size of the ECP. Data are mean ± SEM. *p < 0.05, comparing synj1/synj2 with phospho-null SynjS1029A. B, Cumulative quantal content plot. Linear regression analysis was used to back extrapolate from points between stimulus pulses 2500 and 4200 for indicated genotypes. ECP estimates were observed from the y-intercepts. C, Box plot showing ECP estimates obtained from linear regression analysis of cumulative quantal content plot for the indicated genotypes. Red dot indicates the mean value. *p < 0.05, compared with control. **p < 0.05, indicated genotypes compared with synj1/synj2. A–C, n = 6 NMJ from 6 larvae for each genotypes. D, Total synaptic vesicle pool size estimates for the indicated genotypes. synj1/synj2 has a reduced total pool size. n = 4 per genotype. Data are mean ± SEM. *p < 0.05 compared with control. E, Relative EPSP amplitude in the presence of ML-7 treatment (to inhibit mobilization of the RP vesicles) or vehicle control. n > 6 NMJ from >6 larvae per genotype. Data are mean ± SEM. *(black), p < 0.05, comparing control treated with vehicle (DMSO) to synj mutant. *(red), p < 0.05, comparing synjS1029A expression in synj mutant background to synj mutant. *(blue), p < 0.05, comparing control or synjS1029E expression in synj mutant background to synj mutant. **(and bracket), p < 0.05, comparing control with SynjS1029E expression in synj mutant background. Nonlinear summation correction was used to determine quantal content.
