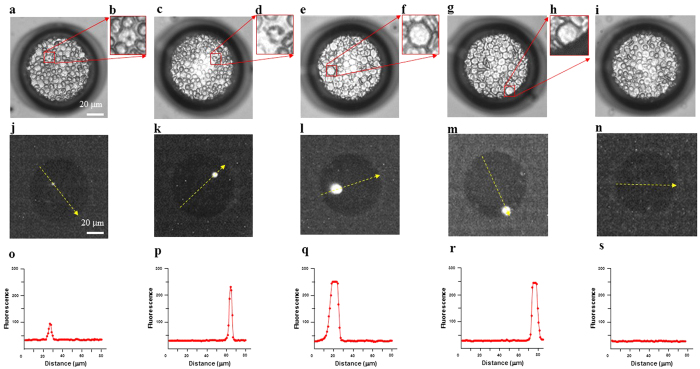
Figure 3. Discrimination of leukocytes and malaria parasite-infected erythrocytes in the microchamber.
(a,c) Light microscopic images of malaria parasite-infected erythrocytes dispersed in a microchamber. Malaria parasite-infected erythrocytes were observed in the boxed regions. (b,d) Magnified views of the boxed regions. (e,g) Light microscopic images of cells in whole blood in a microchamber. A leukocyte is seen in each boxed region. (f,h) Magnified views of the boxed regions. (i) Light microscopic image of non-infected erythrocytes dispersed in the microchamber. (j,k) Fluorescent images of malaria parasite-infected erythrocytes in the microchamber visualized with a CCD camera. (l,m) Fluorescent images of leukocytes. (n) Image of non-infected, fluorescence-negative erythrocytes. (o–s) Fluorescence-intensity profile along the yellow-dotted arrow in each image shown in (j–n) respectively.

