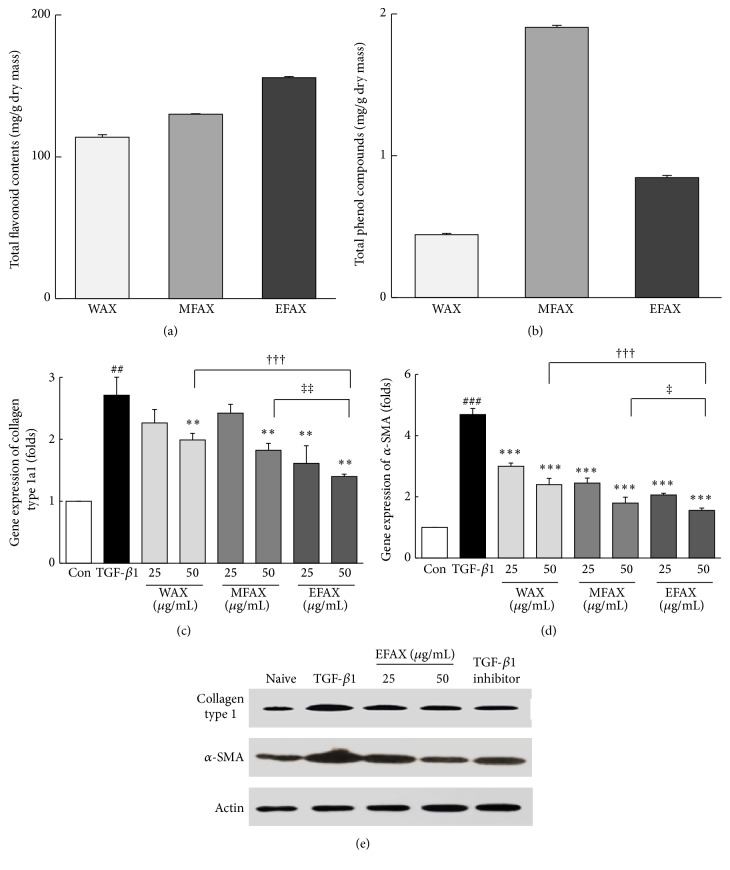
Figure 3.
Total flavonoid and phenolic contents and mRNA expression and protein levels in HSC-T6. (a) Total flavonoid contents values are expressed in terms of quercetin equivalent (mg/g of dry mass) and (b) the total phenolic contents values are expressed in terms of gallic acid equivalent (mg/g of dry mass). The analysis of mRNA expression levels was performed for (c) Col 1a1 and (d) α-SMA using real-time PCR in HSC-T6 cells. (e) The protein levels of Col 1 and α-SMA are examined using western blot. The data are expressed as the mean ± SD (n = 4). ## p < 0.01, ### p < 0.001 compared to the control group; ∗∗ p < 0.01, ∗∗∗ p < 0.001 compared to the TGF-β1 treatment group; ††† p < 0.001 comparison of WAX 50 and EFAX 50; † p < 0.05, ‡‡ p < 0.01 comparison of MFAX 50 and EFAX 50.

