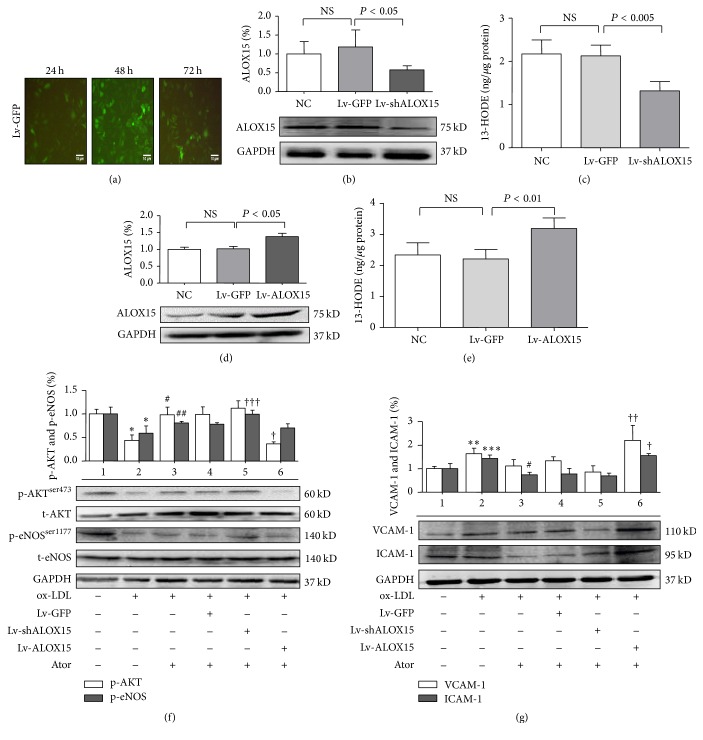
Figure 3.
Changes in expression levels of ALOX15, AKT, eNOS, VCAM-1, and ICAM-1 in HUVECs 24 h following exposure to ox-LDL (100 mg/L) or atorvastatin (10 μM). (a) Photographs of Lv-GFP-transfected HUVECs. GFP expression was visualized by fluorescence microscopy (100x) at 24, 48, and 72 h after transfection. The scale bar represents 10 μm. (b) and (c) Western blot and EIAs indicated that Lv-shALOX15 downregulated ALOX15 protein expression and enzyme activity. (d) and (e) Western blot and EIAs indicated that Lv-ALOX15 upregulated ALOX15 protein expression and enzyme activity. (f) Western blot analysis of AKT/eNOS expression in HUVECs. (g) Western blot analysis of VCAM-1/ICAM-1 expression in HUVECs. Group 1: normal control group; Group 2: ox-LDL (100 mg/L); Group 3: ox-LDL (100 mg/L) + atorvastatin (10 μM); Group 4: Lv-GFP + ox-LDL (100 mg/L) + atorvastatin (10 μM); Group 5: Lv-shALOX15 + ox-LDL (100 mg/L) + atorvastatin (10 μM); and Group 6: Lv-shALOX15 + ox-LDL (100 mg/L) + atorvastatin (10 μM). Results are expressed as mean ± SD. NC: normal control group; NS: not significant. ∗ P < 0.001, ∗∗ P < 0.01, and ∗∗∗ P < 0.05 versus Group 1; # P < 0.001 and ## P < 0.05 versus Group 2; and † P < 0.001, †† P < 0.01, and ††† P < 0.05 versus Group 4. N = 4 per group.

