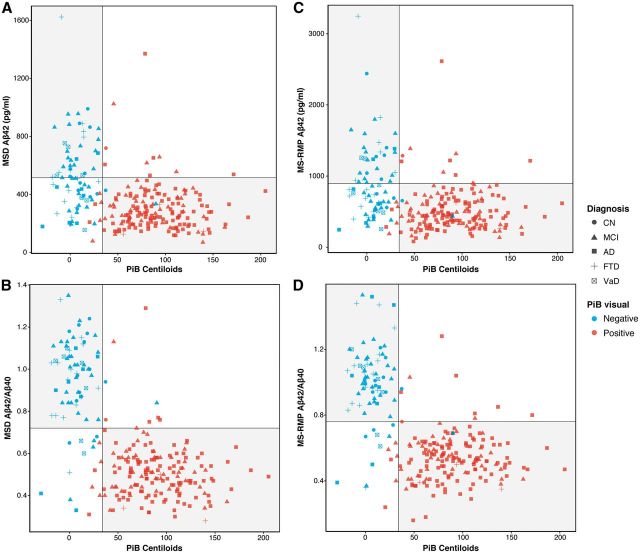
Figure 4.
Scatterplots reflecting concordance between PiB Centiloids and reanalysed CSF. (A) MSD amyloid-β42 (cut-off < 515 pg/ml). (B) MSD amyloid-β42/40 (cut-off < 0.72); (C) MS-RMP amyloid-β42 (cut-off < 896 pg/ml), and (D) MS-RMP amyloid-β42/amyloid-β40 (cut-off < 0.76). Grey circles indicate cognitively normal healthy control subjects, triangles indicate MCI, squares indicate Alzheimer’s disease, crosses FTD, and crossed squares VaD. The vertical lines reflects the Centiloid cut-off of 34; the horizontal lines the cut-offs of < 515 pg/ml, <0.72, <896 pg/ml, and <0.76 for MSD (amyloid-β42, amyloid-β42/40) and MS-RMP (amyloid-β42, amyloid-β42/40), respectively. Blue indicates PiB scans visually rated as negative, red as positive. The grey quadrants indicate concordance between amyloid-β biomarkers (top left, concordant negative: PiB−/CSF−; bottom right, concordant positive: PiB+/CSF+). The white quadrants indicate discordance between amyloid-β biomarkers (bottom left, discordant with isolated CSF positivity: PiB−/CSF+; top right, discordant with isolated PiB positivity: a PiB+/CSF−). Aβ = amyloid-β.

