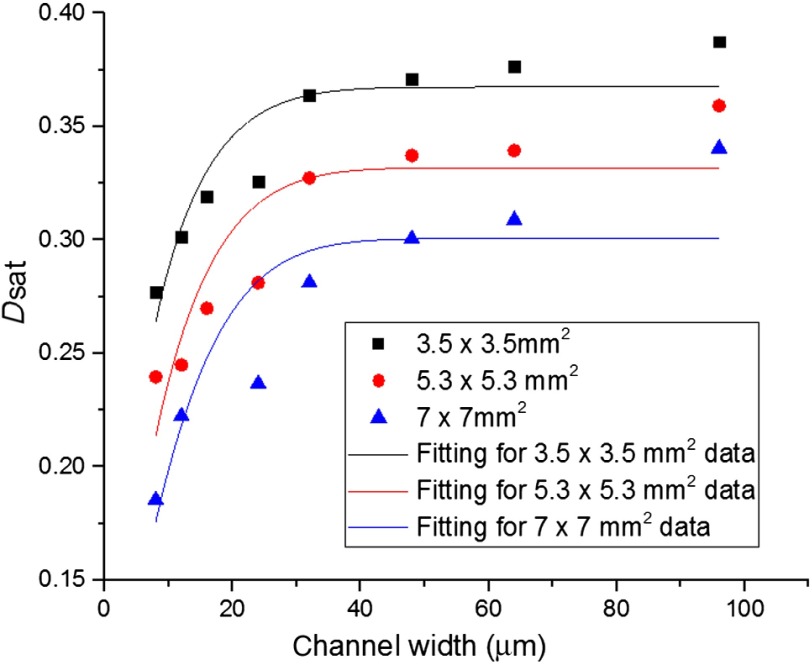
Fig. 7.
Relationship between the saturated decorrelation value and channel width at a blood flow speed of . Black squares, red circles, and blue triangles are data points of three different scan sizes, , , and , respectively. Black, red, and blue lines show the results of fitting with Eq. (5) for the three different scan size. is a model parameter that describes the maximum value of .

