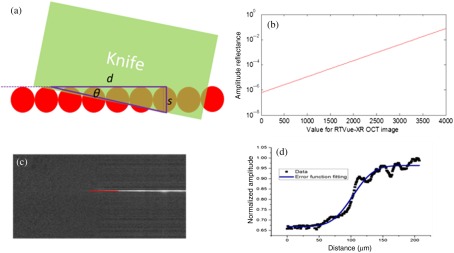
Fig. 8.
Determination of beam focal spot diameter by the measurement of OCT amplitude from a knife edge. (a) Schematic of the setup for the measurement of the focal spot size. (b) The relationship between real amplitude reflectance and the readings from OCT image. (c) The B-scan OCT image from the knife edge measurement. The red lines indicate the location to draw the profile for (d). (d) The normalized amplitude profile of OCT amplitude signal (black dots) along with the curve fitting results (blue line). The fitting function is an error function: , where err represent the error function, is the OCT amplitude, is the position of beam focal spot, and to are the fitting parameters. Based on the fitting results, the focal beam diameter () was found to be and the corresponding FWHM beam diameter was .

