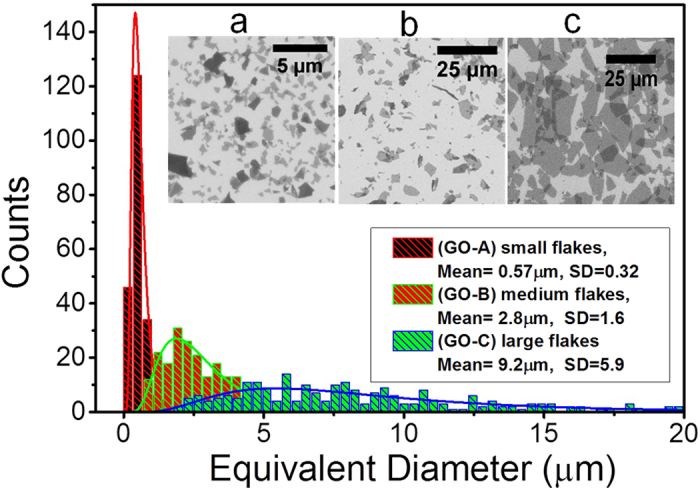
Figure 2. Scanning electron microscopy (SEM) images of the GO flakes.

(a) GO-A, (b) GO-B and (c) GO-C. The size (equivalent diameter) distribution of GO flakes obtained by SEM, the mean size, and its standard deviation SD for all flake batches are indicated in the inset, (note the difference in scale in the SEM images).
