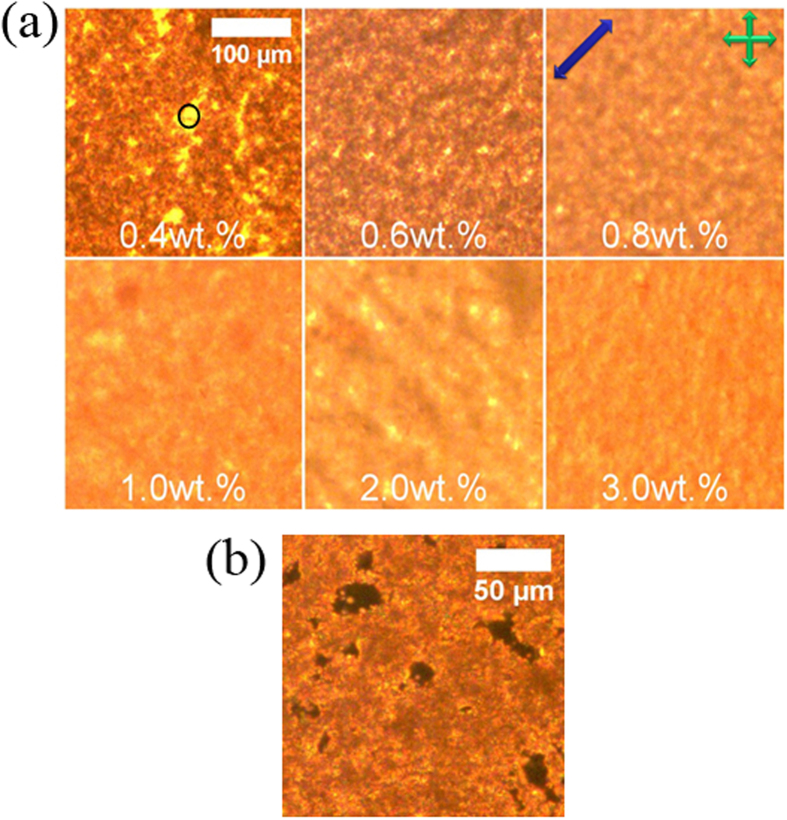
Figure 3.
(a) Polarizing optical images obtained from liquid crystal cells with planar boundary conditions, filled with (GO-A) + 5CB mixtures at concentrations of 0.4, 0.6, 0.8, 1.0, 2.0 and 3.0 wt.%. Bright areas (inside the circle) indicate an undisturbed liquid crystal director orientation while darker areas show graphene oxide aggregates. The rubbing direction (blue arrow) is aligned at 45° to the crossed polarizers (crossed green arrows). (b) The bottom image is for a GO-A + 5CB filled cell at concentration 0.4 wt.% with the director parallel to one of the polarizers. One can clearly see remains of liquid crystal regions (black), surrounded by graphene oxide aggregates with a highly distorted director field. An equivalent behaviour is observed for the other samples.

