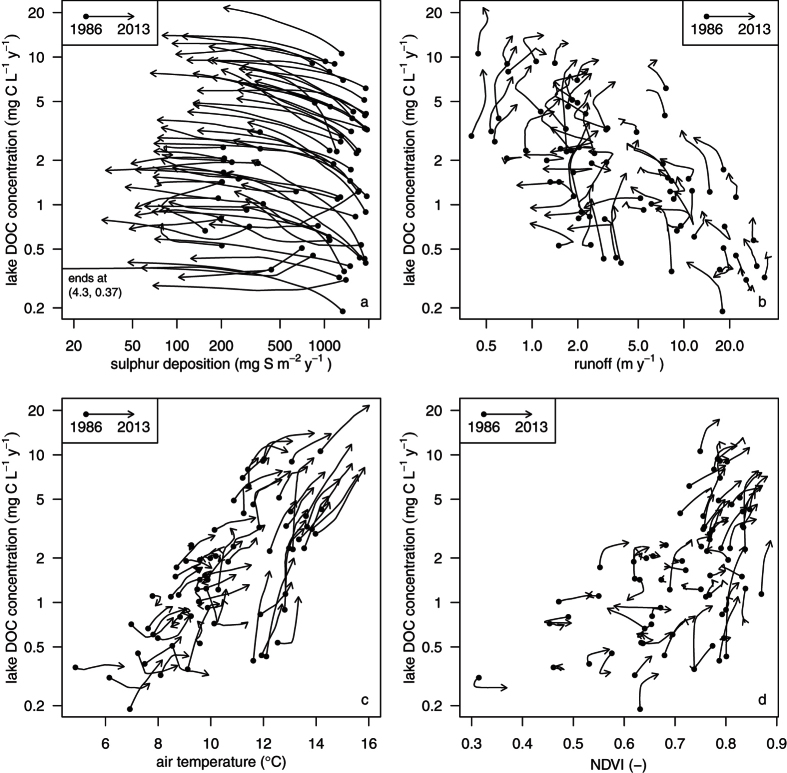
Figure 2. Pairwise time-trend relations between individual driver variables and DOC.
Two-dimensional cross smoothed time series curves starting from 1986 (dots) to 2013 (arrow heads) for individual lakes, where DOC concentration is plotted against (a) sulphur deposition, (b) runoff, (c) surface air temperature and (d) NDVI. Each curve represents a time series for a lake. Coordinates were obtained by smoothing lake-specific time series using lowess61 with a smooth span of 0.8. Only those years with a complete pair of observations are used in this figure. Lake DOC concentration, total sulphur deposition and runoff are scaled logarithmically.

