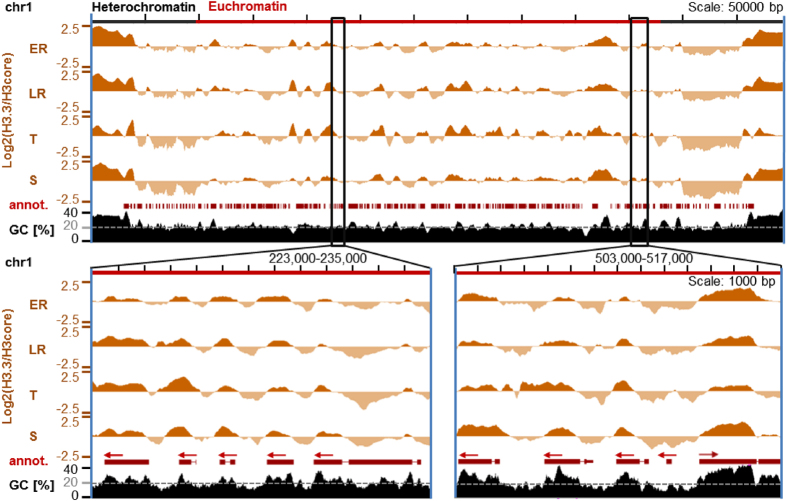
Figure 1. PfH3.3-Ty1 ChIP-seq profiles from different stages of intraerythrocytic development.
ChIP-seq ratio tracks displaying relative enrichment of the endogenous PfH3.3-Ty1 compared to H3core (antibody capturing histone PfH3 and PfH3.3) over entire chromosome 1 (upper panel) or two smaller sections of it (lower panels). Red arrows indicate the directionality of the respective gene (“annot.”). Stages: ER: early rings (10 hpi), LR: late rings (20 hpi), T: trophozoites (30 hpi), S: schizonts (40 hpi). Heterochromatic regions are defined based on HP1 occupancy in an earlier study43.

