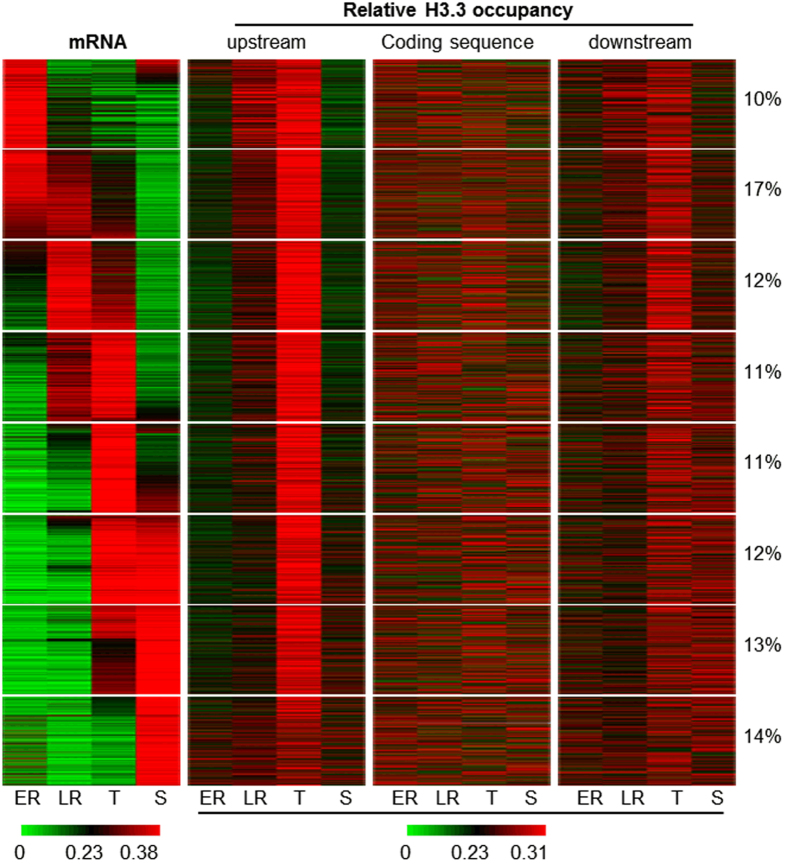
Figure 3. PfH3.3 dynamically occupies intergenic regions predominantly during trophozoite stage.
Heatmap represents relative mRNA abundance of 3800 genes (heterochromatic and genes with low mRNA abundance have been excluded) and relative PfH3.3 occupancy in upstream, coding and downstream region throughout intraerythrocytic development. Color-scale depicts the relative mRNA abundance in relation to the sum of the RPKM values in all four stages or the relative PfH3.3 occupancy in proportion to the sum of occupancy values in all four stages (green – low, red – high). 8 groups of co-expressed genes were identified using k-means clustering. The percentage of genes belonging to each cluster is displayed next to the heatmap. Stages: ER: early rings (10 hpi), LR: late rings (20 hpi), T: trophozoites (30 hpi), S: schizonts (40 hpi).

