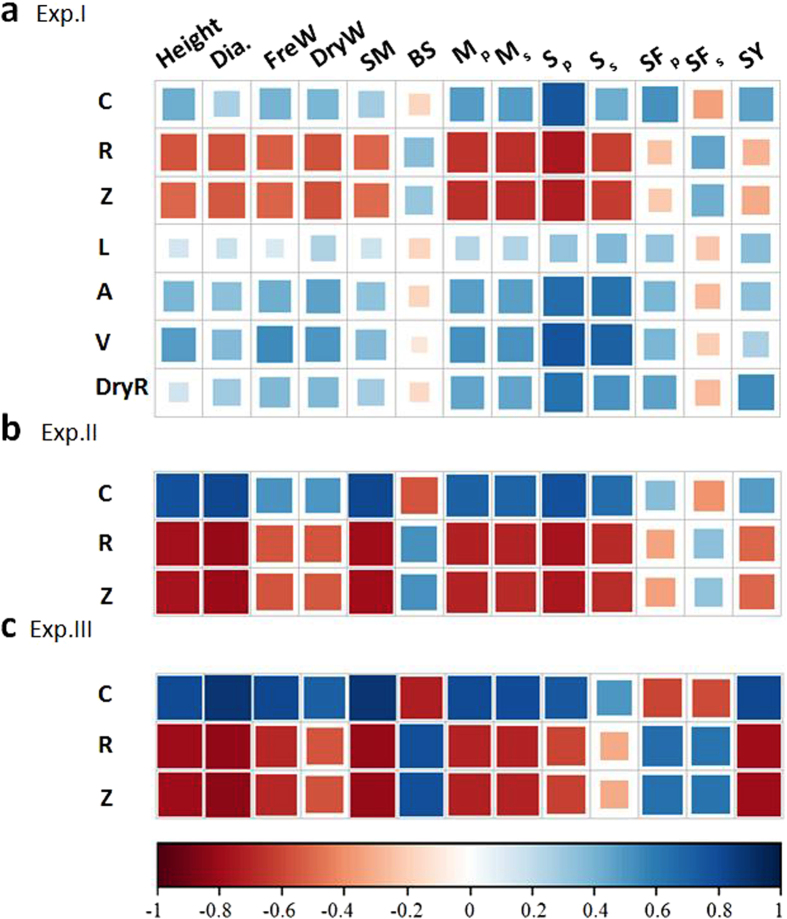
Figure 5.
Colour map for the relationship of root capacitance (C), resistance (R), impedance (Z), root length (L), root surface (A), root volume (V), and root dry weight per plant (DryW) with plant height (H), basal stem diameter (Dia.), fresh weight per length (FreW), dry weigh per length (DryW), section modulus (SM), bending stress (BS), self–weight moment for root (Mp), self–weight moment for stem (Ms) and seed yield (SY). High colour density and larger square area indicates strong relationship. Blue and red colour represents positive and negative relationship, respectively.

