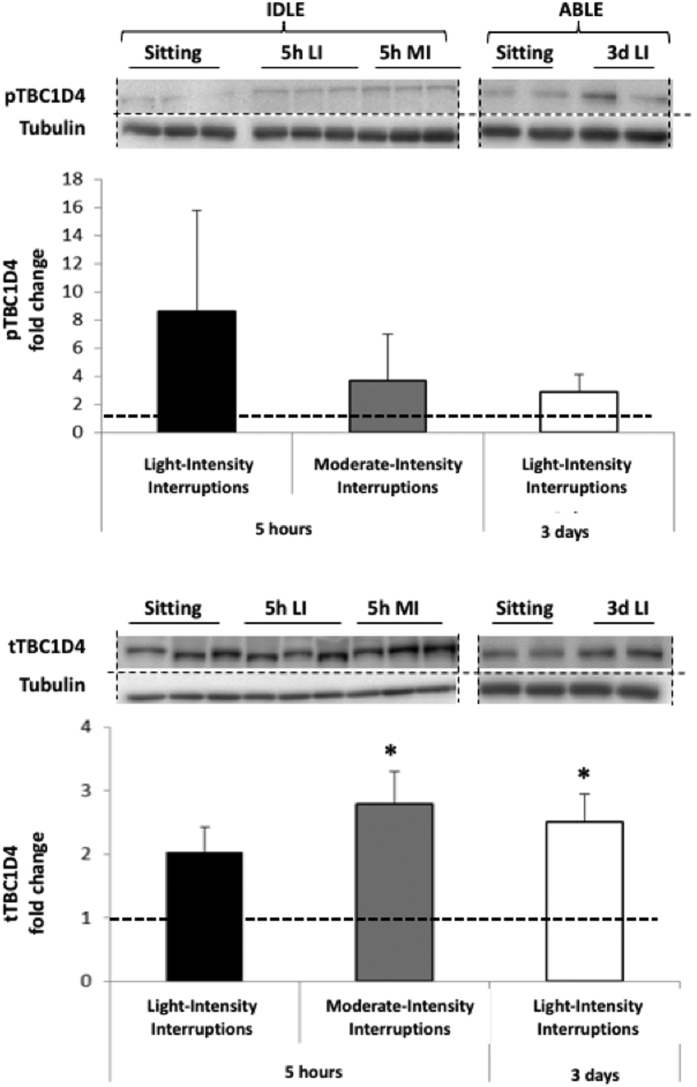
Figure 5. Changes in phosphorylated (Top) and total (Bottom) TBC1D4 protein expression in skeletal muscle following 5 hr light- (5h LI, n = 6) or moderate-intensity (5h MI, n = 6) interruptions, or 3 days of light-intensity interruptions (3d LI, n = 5) compared to uninterrupted sitting (value of 1).
Data represent mean ± SEM. Representative blots are shown above the graphs. Dotted lines are showing where the images have been cropped; Full length blots/gels are presented in Supplemental Figure 2 (IDLE, Tubulin), 4 (AIDLE, TBC1D4) and 6 (ABLE, TBC1D4 and Tubulin). Protein expression of TBC1D4 (160 kDa) and tubulin (52 kDa) have been measured on the same blot. All the blots have been run under exact same conditions. *P < 0.05 vs. sitting.

