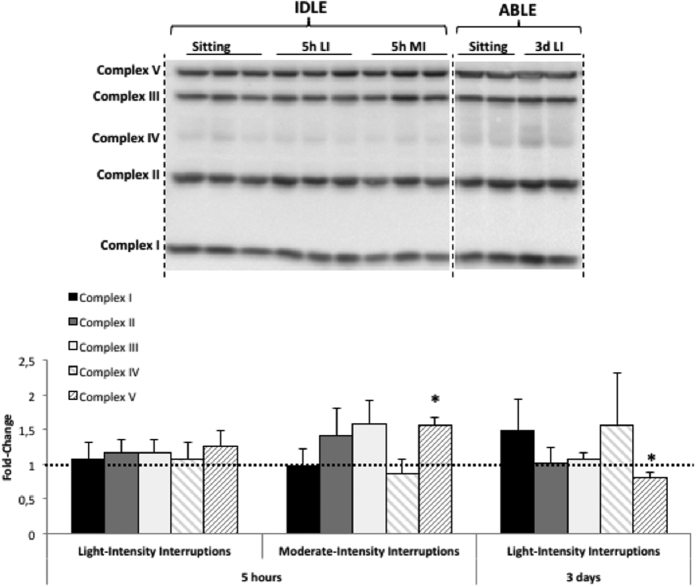
Figure 6. Changes in expression of oxidative phosphorylation (OXPHOS) complexes I to V of the electron transport chain in skeletal muscle following 5 hr light- (5h LI, n = 6) or moderate-intensity (5h MI, n = 6) interruptions, and 3 days of light-intensity interruptions (3d LI, n = 5) compared to uninterrupted sitting (value of 1).
Data represent mean ± SEM. Representative blot is shown above the graphs. Dotted lines are showing where the images have been cropped; Full length blots/gels are presented in Supplemental Figure 7 (IDLE and ABLE). Samples from IDLE have been analysed altogether on one blot, samples from ABLE have been analysed altogether on another separate blot. All the blots have been run under exact same conditions. *P < 0.05 vs. sitting.

