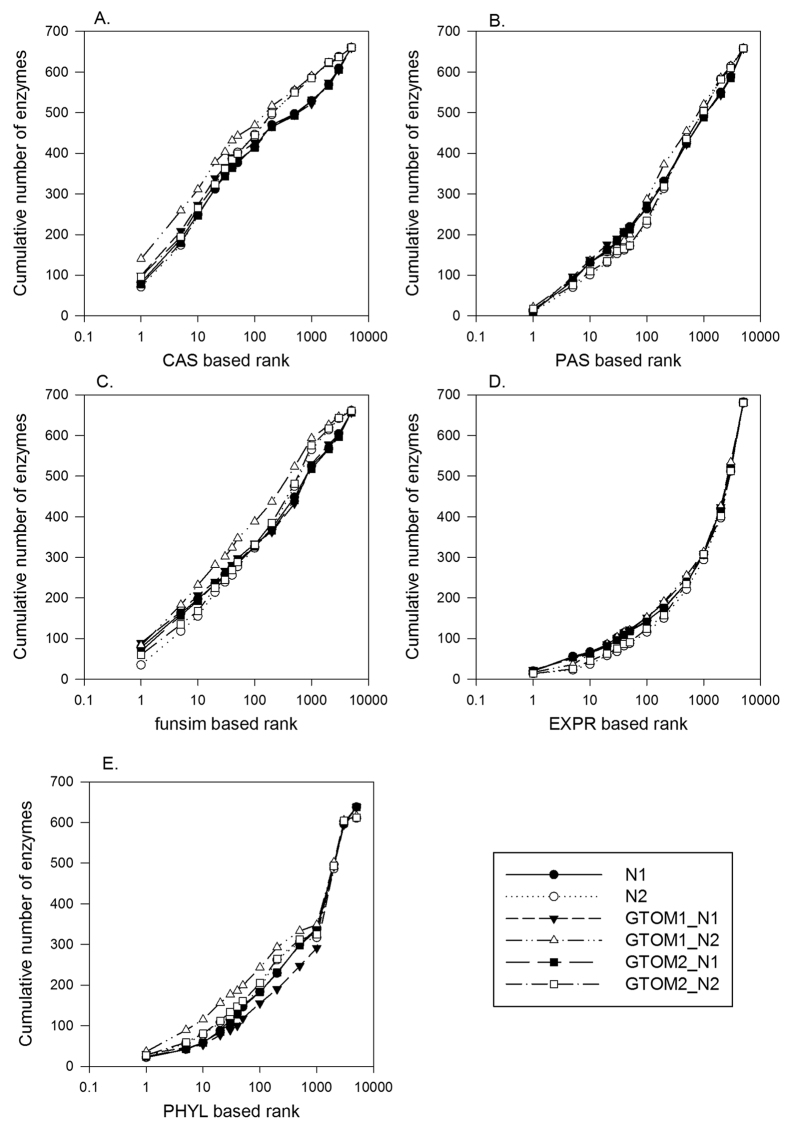
Figure 3. Score performance with multi-level neighbors and GTOM weights.
For each feature score, six combinations of network neighbor levels and GTOM weights were compared in terms of the cumulative ranks of correct enzyme among 5200 candidates. The six variations of a score of type t are two neighbor levels from Eq. 7, and four combinations of two neighbor levels of the score, and two neighbor levels for GTOM weights. (A) CAS. MRR for N1, N2, GTOM1_N1, GTOM1_N2, GTOM2_N1, and GTOM2_N2 were 0.199, 0.186, 0.223, 0.294, 0.192, and 0.219, respectively. (B) PAS. MRR were 0.072, 0.059, 0.077, 0.083, 0.072, and 0.070, for the same order of the score forms as CAS. (C) funsim. MRR values were 0.173, 0.114, 0.186, 0.191, 0.164, and 0.143, respectively. (D) EXPR. MRR were 0.055, 0.032, 0.055, 0.046, 0.053, and 0.034, respectively. (E) PHYL. MRR were 0.054, 0.061, 0.060, 0.096, 0.056, and 0.069, respectively.

