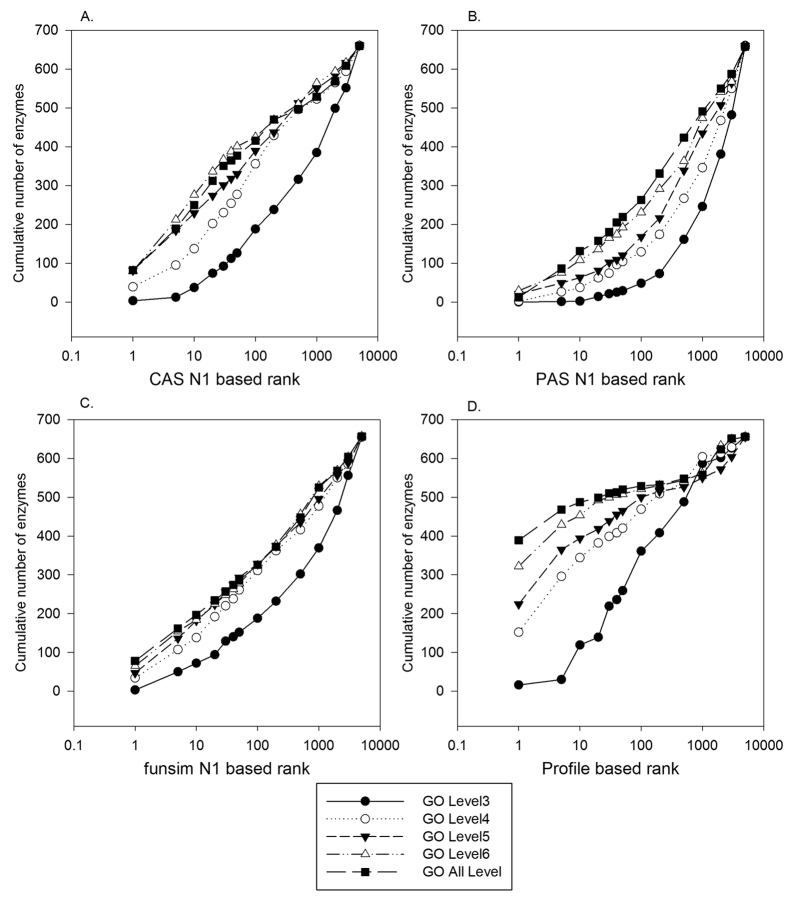
Figure 4. Performance of GO-based Feature scores with different GO levels.
The performance of CAS, PAS, funsim, and PROFILE (the cumulative number of correct enzyme recognized within certain top ranks) was examined using five different resolution levels of GO terms of candidates, parental term mappings to the 3rd, 4th, 5th, and 6th level in the GO hierarchy as well as the original GO annotations. The relatedness score (Eq. 7) with the 1st level neighbors (k = 1) was used (showed N1 in the figure legend). (A) CAS. MRR using the GO level 3, 4, 5, 6, and the original annotation were 0.002, 0.104, 0.184, 0.207, and 0.199, respectively. (B) PAS. MRR were 0.004, 0.023, 0.054, 0.081, and 0.072, respectively, for the same order of GO annotation levels as CAS. (C) funsim. MRR were 0.041, 0.104, 0.135, 0.155, and 0.173, respectively. (D) PROFILE. MRR were 0.058, 0.314, 0.416, 0.541, and 0.617, respectively.

